One of the most widely used and oldest species identification techniques is « morphological identification », which identifies individuals by their anatomical characteristics. However, this technique has the disadvantage of not being always accurate since it depends on the observation and the identification protocol of the person who performs it.
An alternative to this identification technique could be computer vision algorithms. These algorithms allow us to identify the characteristics of an image in a fast and accurate way, so the identification of a species can be made only through a photo, making it more portable.
In the following, we try to identify different mushroom images with the help of computer vision. This work was realized together with my promotion colleague Cyril Vandenberghe and supervised by Adrien Ruimy. It corresponds to the DataScientest data scientist course final project. The development took a hundred hours and allowed us to utilize our newly acquired knowledge in a practical application.
For this project, we used data from mushroomobserver.org, a website dedicated to collect and identify mushroom images: Users upload images, and the community identifies them. Currently, it counts over 10,000 registered users.
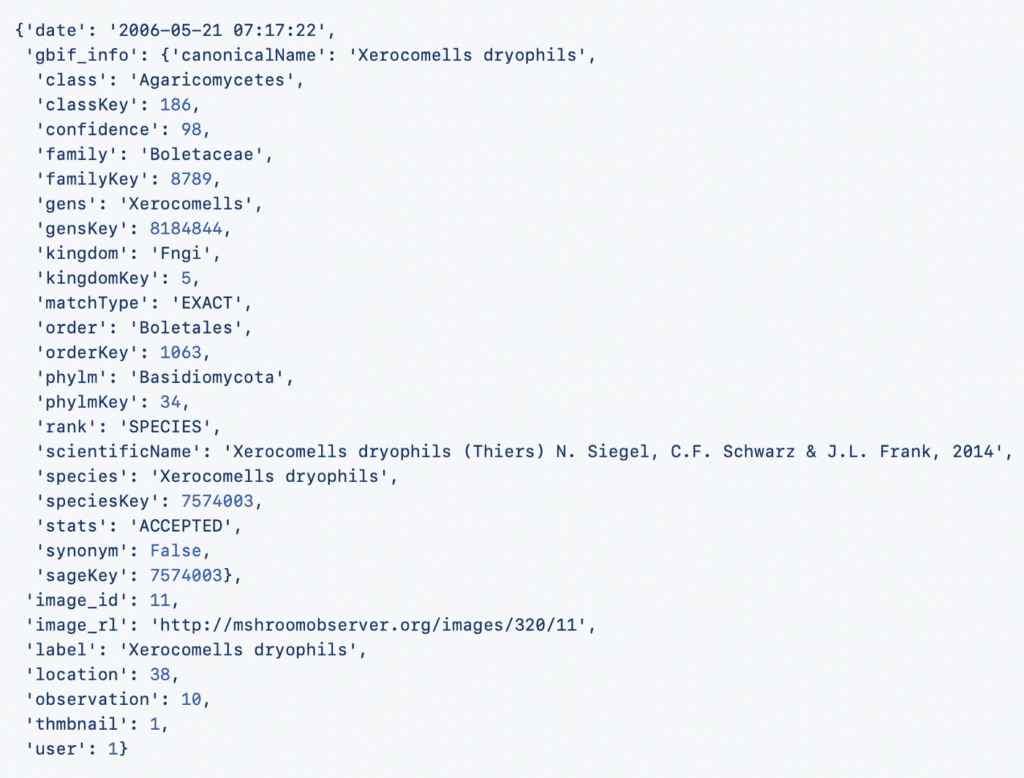
During our initial bibliographical research, we found that a previous project hosted on Github, « mushroomobser-dataset » had already explored this site to create a dataset of images dating from 2006 to 2016. Additionally, 12 JSON files contain additional information about each image.
Fig. 1. Example of a JSON entry for one image. (image by Github: bechtle).
Data exploration
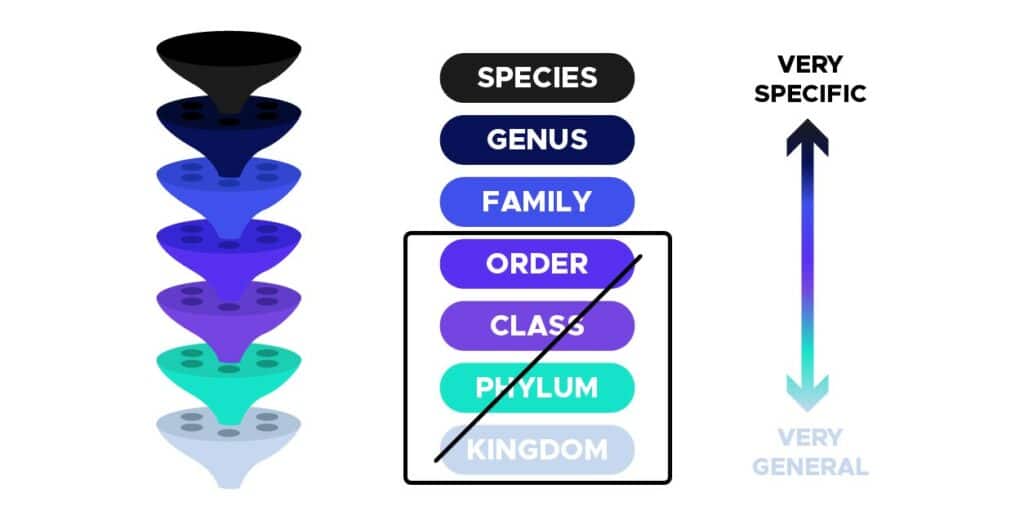
The first step in processing our data was to create a data frame with information about the images and taxonomy of the mushrooms. In biology, a taxonomy is a way of defining hierarchical groups based on common characteristics, as shown in the figure below :
Fig. 2. Taxonomy organization (Image by author).
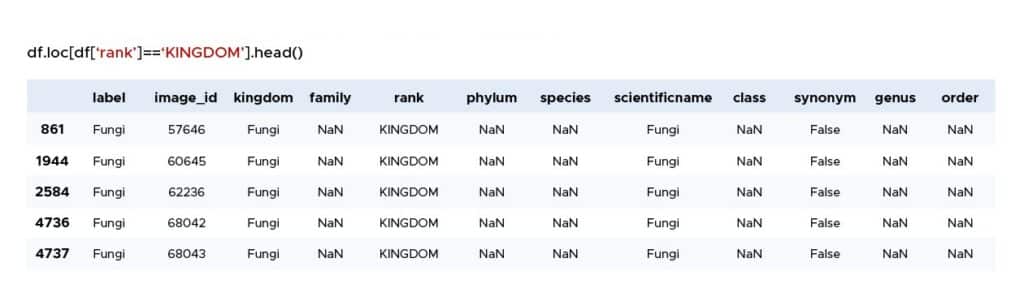
In the table 1, the `rank` column indicates the last taxonomic level reached in the mushroom identification in our data frame. Thus, if an entry has the value `KINGDOM` in the `rank` column, the `label` column value will be the most general identification, e.g., `Fungi.` The identified images can therefore belong to any mushroom.
Table 1. Example of values in the data frame when "rank" = "KINGDOM".
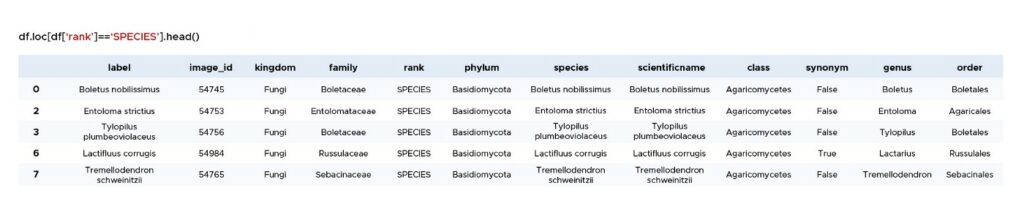
In contrast, if the `rank` column is `SPECIES`(a more specific taxon), we have a more detailed description of the images (table 2).
Table 2. Example of values in the data frame when "rank" = "SPECIES".
Therefore, images with `KINGDOM`, `PHYLUM`, `CLASS`and `ORDER`values in the `rank` column were discarded, as they are too general and non-informative. For the rest of the project, we will only work with data belonging to the taxa SPECIES, GENUS, and FAMILY as shown in the figure below :
Fig. 3. Selected taxa (Image by author).
Data Visualisation
Having a large number of images is essential for successfully developing a computer vision project. In this project, we need labels (i.e., values in the `label` column) to have a large number of images to represent it for each taxon.
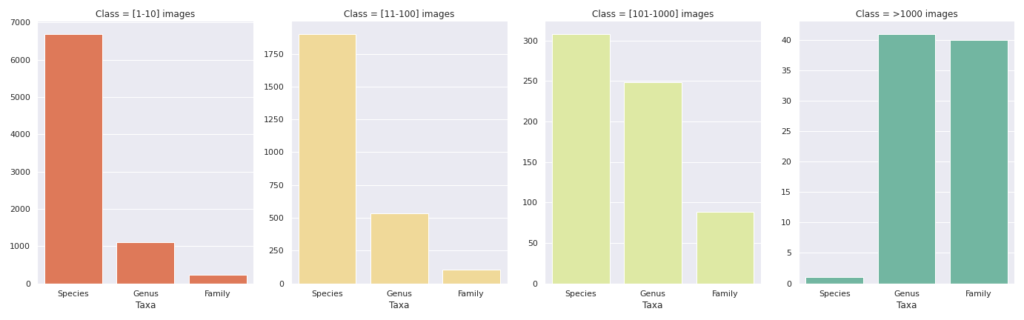
The image below (fig. 4) is a visualization of the distribution of the number of images in the taxa. Each of the four panels shows the number of labels (y-axis) for a given taxon (x-axis) represented by 1 to 10 images, 11 to 100 images, 101 to 1000 images, and over 1000 images.
FIg. 4. Number of labels per taxon by range. (image by author).
The species taxon is the ideal one because it is the most specific one. However, the number of labels represented by only 1 to 10 images corresponds to 75% of the total number of species. In the interval [101–1000], only seven species have more than 500 images, and only one species has more than 1000 images.
In contrast, in the panel for categories with more than 1000 images, we observe the genus and family taxa with about 40 labels each, making them good targets. Taxonomically, family is the least specific level, so we would expect more heterogeneity in images if we pick this level. Using genus seems then a good compromise between the taxonomic level and the number of images available.
Final Dataset : Genus Taxa
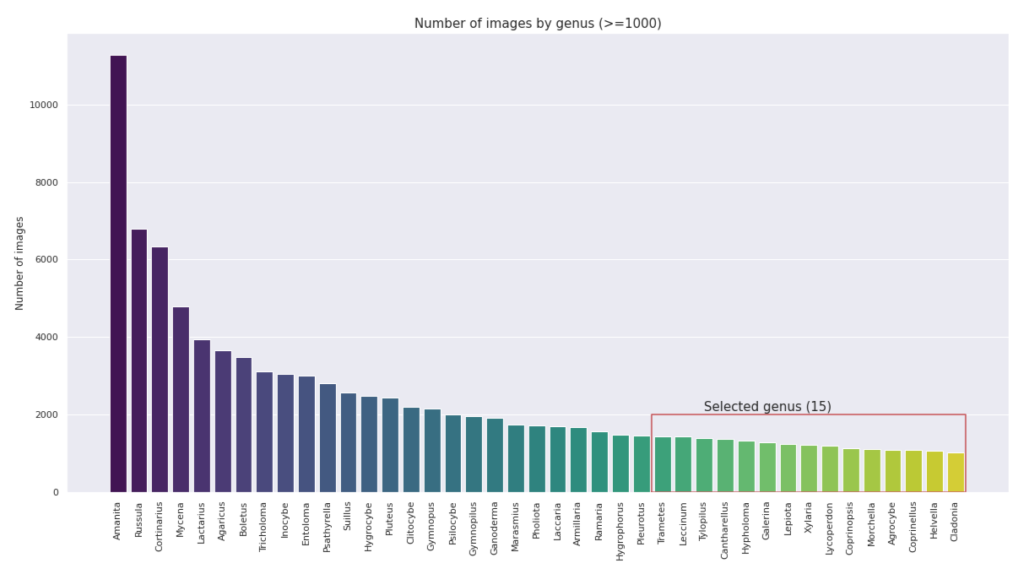
The bar chart below shows the number of images for 41 selected genus (Fig. 5). We decided to limit ourselves to the 15 highlighted genera containing ~1,000 images to reduce computation time and avoid a biased representation. With this, we have a total of 18,412 images available for the classification/modeling part of our project.
Fig. 5. Histogram showing the distribution of images in the 41 genus containing more than 1000 images and the 15 genus selected for the project analyses (in the red square). (Image by author)
Classification using Neural Networks
Architectures
As mentioned before, this project aims to identify mushroom images, which is a typical image classification problem that is usually addressed by deep learning methods. To achieve our goal, we tested three models, detailed below.
LeNet
First, we tested our data on a CNN model with a LeNet architecture (Y. LeCun et al., 1998) that contains layers adapted for image processing. We tested this model with two convolutional layers.
With a value of 0.98% accuracy, the basic model does not seem suitable for our goal, so we did not pursue this model further.
VGG16
Next, we used the VGG16 model (Simonyan and Zisserman, 2015), an image classification model with a Transfer Learning approach.
In the first step, our model had one classification layer with a Sequential model, two neural layers (Dense), and two regularization layers (Dropout).
The results obtained were encouraging, with an accuracy of about 70%, but the model suffered from overfitting. To counter this, we added a Dense layer and increased the Dropout value. The figure 6 shows the final architecture of the model.
Fig. 6. Final VGG16 Architecture (image by author).
Additionally, we used the EarlyStopping and ReduceLROnPlateau callbacks from the Keras package with patience values of 5 and 3 respectively. With this, we achieved an accuracy value of 75.5% without overfitting.
EfficientNetB1
The third image classification method we used in this project was also a Transfer Learning approach with the Tensorflow EfficientNet model (Tan and Le, 2019). We took inspiration from our previous model (VGG16) for the classification architecture we implemented, as we had positive results (fig. 7). We also used the callbacks EarlyStopping and ReduceLROnPlateau with the same values.
Fig. 7. Fnal EfficientNetB1 architecture (image by author).
The first results show an accuracy value of about 80%, better than with VGG16, but still showing overfitting, so we increased the value of the Dropout layers and finally got a score of 79% without overfitting.
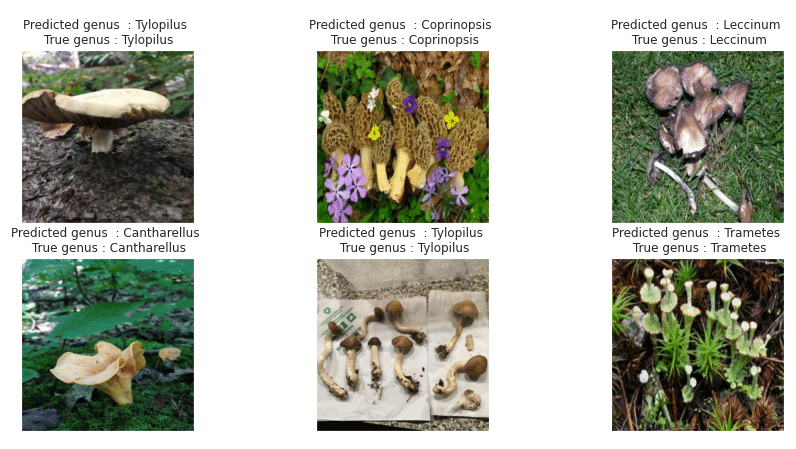
Here is a display of the model’s predictions on six images :
Fig. 8. Example of prediction result, showing the predicted genus vs true genus. (image by author).
Error Analysis
Confusion matrix
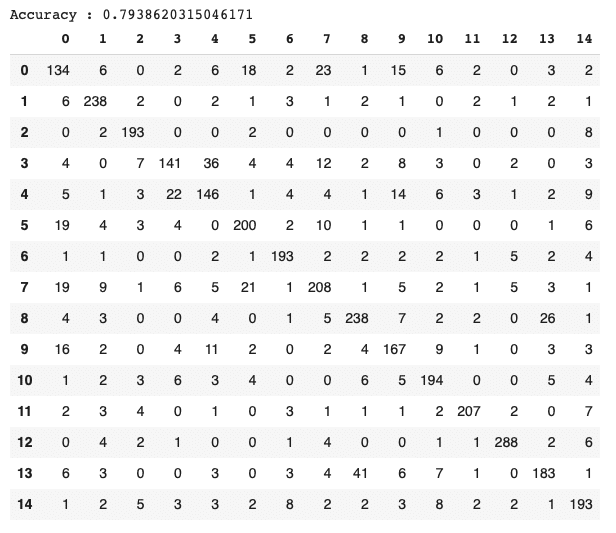
The confusion matrix (fig. 9) shows that classes 0, 3, and 8 tend to be classified as classes 7, 4, and 13, respectively :
Fig. 9. Confusion matrix from EfficientNet prediction (image by author).
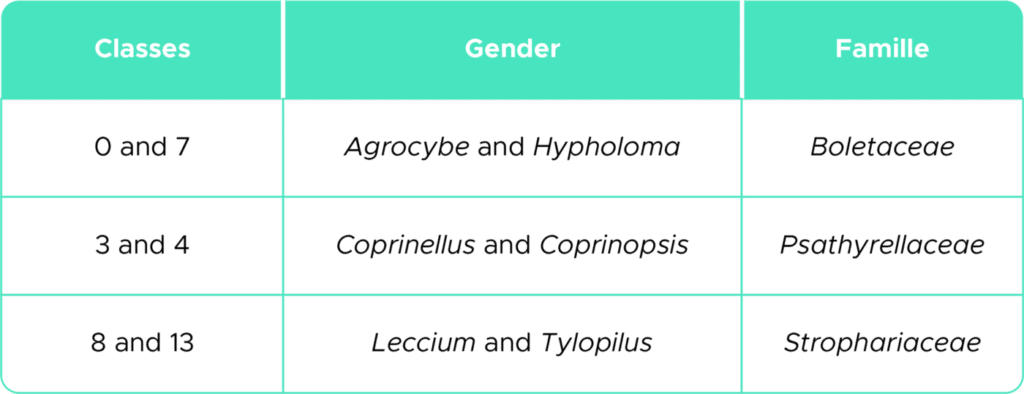
Literature shows that these confused classes are very similar morphologically and belong to the same taxonomic family (table 3).
Table 3. Confused classes.
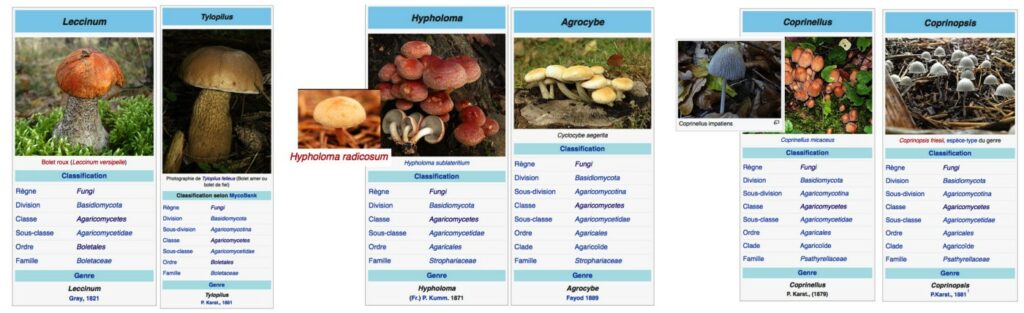
The figure 10 show these morphological similarities between confused classes :
Fig. 10. Morphological similarities between confused classes (source: Wikipwdia).
One reason for the confusion of classes may be that the taxonomic identification of mushrooms is wrong. The images we use come from a web page where users classify images of mushrooms only by looking at the images and according to their experience and not according to an objective taxonomic identification protocol.
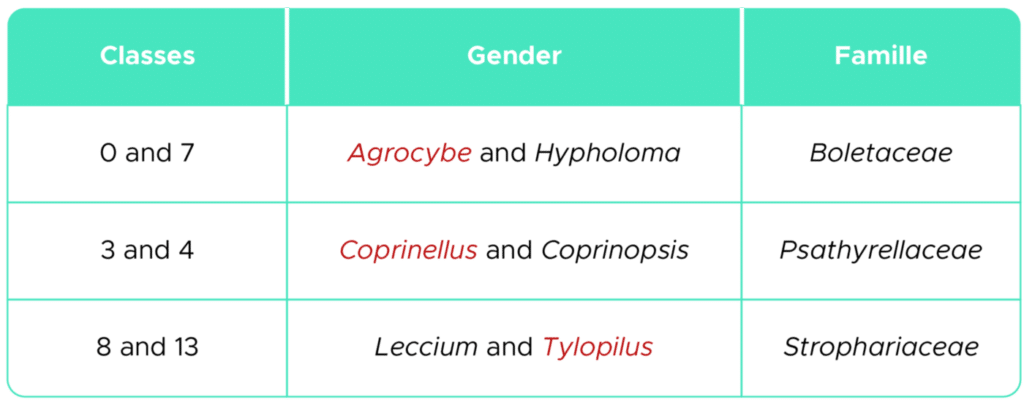
Considering the confusion matrix results, we wanted to evaluate our model without one of the confounded genera to see the influence of the data in our model, as show in the table 4.
Table 4. In red the suppresed genus.
The accuracy values for the 12 genera (without the three eliminated) is 85%, 6% higher than the previous result (79%). This result suggests that we would probably increase our accuracy if we had had a more accurate data set of classifications to train the model.
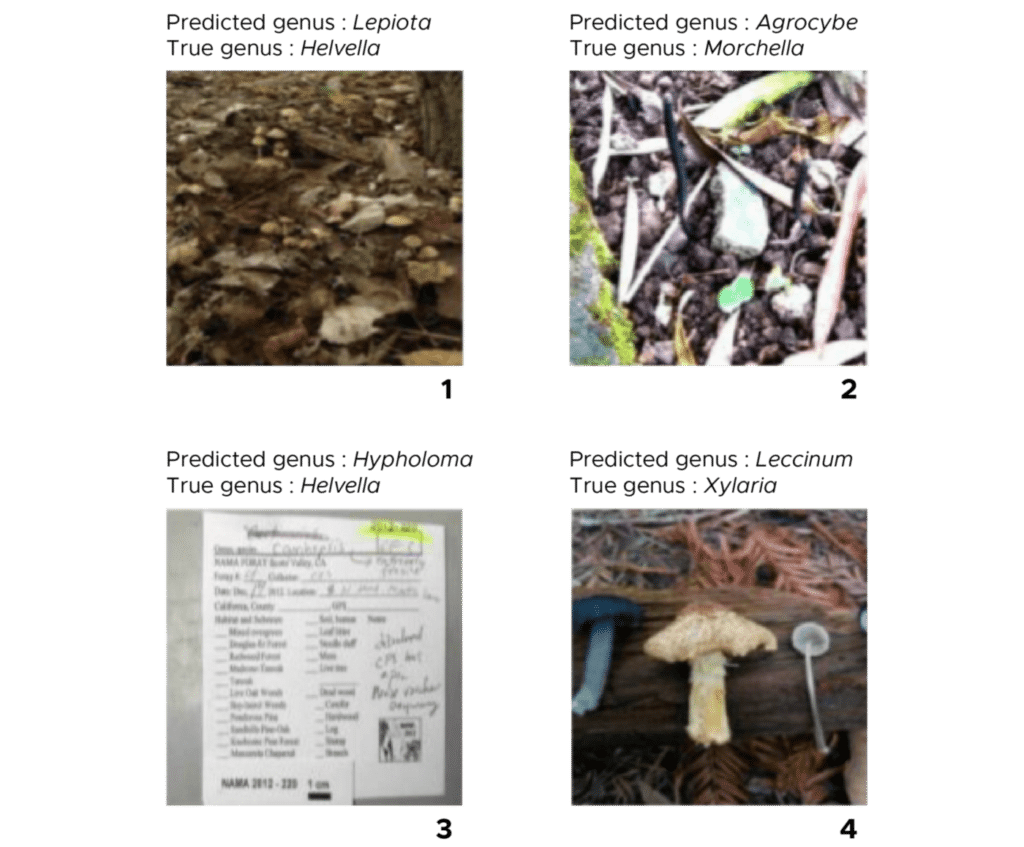
Quality of the images
We have also noticed that the quality of the images is very diverse (Fig. 11). Indeed, some images contain elements that can prevent the model from identifying the mushroom correctly, such as images with a lot of noise around the mushroom to be classified (images 1 and 2). Images with no mushroom to classify (image 3). Images with more than one mushroom (image 4).
Fig. 11. Exemple of image quality (image by author).
Wrapping Up
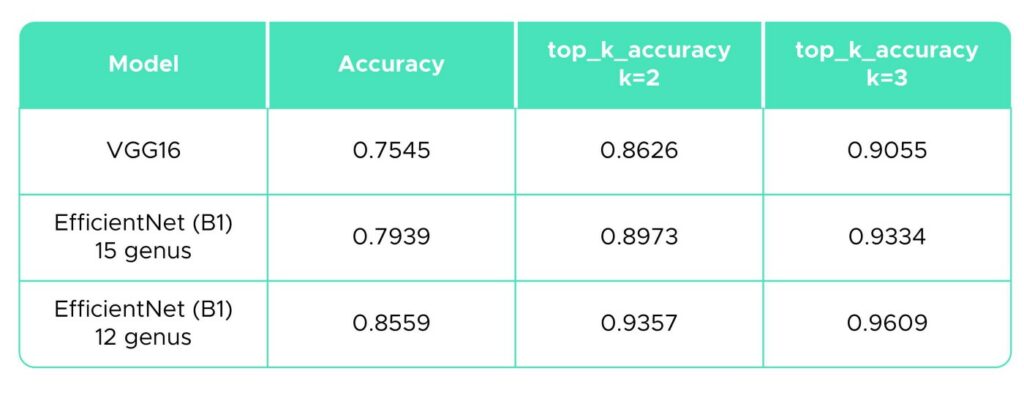
The summary table below (table 5) shows the accuracy values for the three methods used. We also calculated the « top-k accuracy classification score » of the package sklearn.metrics (Pedregosa et al., 2011.) with k = 2 and 3 to assess how often the actual category falls between the two or three most likely categories. According to the results, EfficientNet would be the most suitable approach for our mushroom image classification problem with 80% and 86% accuracy.
Table 5. Summary of results.
Given the results, computer vision appears as an excellent alternative to the morphological classification of species, if the model could be trained using a large number of good quality images and that the species appearing in the image have a taxonomic classification made by a specialist.
Areas of improvement
These results can be improved in several ways. The first thing should be to train the model with an adequate dataset, i.e., better quality images and a more detailed taxonomic classification. Also, increasing the number of images in each label (e.g., from 1000 to 2000) could help to reduce morphological classification errors due to subjective human evaluation.
Another improvement will be increasing the number of genus. Currently, we trained the model using 15 of the 41 genus that had ~1000 images per label. Furthermore, training the same model to further identify images of mushrooms at the species level can also increase the accuracy.
Finally, combining the feature extraction part of our model with a classical classification model, such as Random Forest or SVM, could improve the classification.
References
Y. LeCun, L. Bottou, Y. Bengio, and P. Haffner. 1998. « Gradient-based learning applied to document recognition ».Proceedings of the IEEE.
K. Simonyan, A. Zisserman. 2015. « Very Deep Convolutional Networks for Large-Scale Image Recognition ». Proceedings of the ICLR.
Tan, Mingxing, and Quoc Le. 2019. « EfficientNet: Rethinking Model Scaling for Convolutional Neural Networks ». Proceedings of Machine Learning Research 97.
F. Pedregosa, G. Varoquaux, A. Gramfort, V. Michel, B. Thirion, O. Grisel, M. Blondel, P. Prettenhofer, R. Weiss, V. Dubourg, J. Vanderplas, A. Passos, D. Cournapeau, M. Brucher, M. Perrot and E. Duchesnay. 2011. « Scikit-learn: Machine Learning in Python ». Journal of Machine Learning Research.
Facebook
Twitter
LinkedIn
DataScientest News
Inscrivez-vous à notre Newsletter pour recevoir nos guides, tutoriels, et les dernières actualités data directement dans votre boîte mail.