The Kolmogorov-Smirnov test is a widely used method for comparing data. Discover the amazing story of its invention, and how it is used today in Data Science!
In 1933, Andrei Kolmogorov published an article entitled “Sulla determinazione empirica di una legge di distribuzione” (On the empirical determination of a distribution law).
In it, the mathematician presented the notion of empirical cumulative distribution (ECD) and the corresponding test statistic.
He was interested in how data could be compared with a theoretical distribution without assuming a specific form for the distribution.
His method was based on the maximum difference between the DCE and the DCT (theoretical cumulative distribution), and he proposed a test statistic to quantify this difference.
A few years later, in 1939, Nikolai Smirnov developed a similar approach completely by accident, in his article “Estimation of the difference between empirical distribution functions in two independent samples”.
His aim was also to propose a non-parametric method for comparing two independent samples of data.
For his part, he proposed defining a test statistic based on the maximum difference between the two EDFs of the data samples.
It was only at a mathematics conference that Kolmogorov and Smirnov met by chance. As they began to discuss their respective research, they realised that they were working on similar problems independently.
As they exchanged ideas and results, they were astonished to realise that their methods and formulas were extremely similar.
Surprised by this coincidence, the two mathematicians decided to work together to develop a common approach. They combined their ideas and expertise to create the “Kolmogorov-Smirnov Test”.
What is the Kolmogorov-Smirnov test?
Used in many fields, the Kolomogorov-Smirnov test is a powerful statistical tool. It is used to assess the similarity between an empirical distribution and a theoretical distribution, or to compare two distributions.
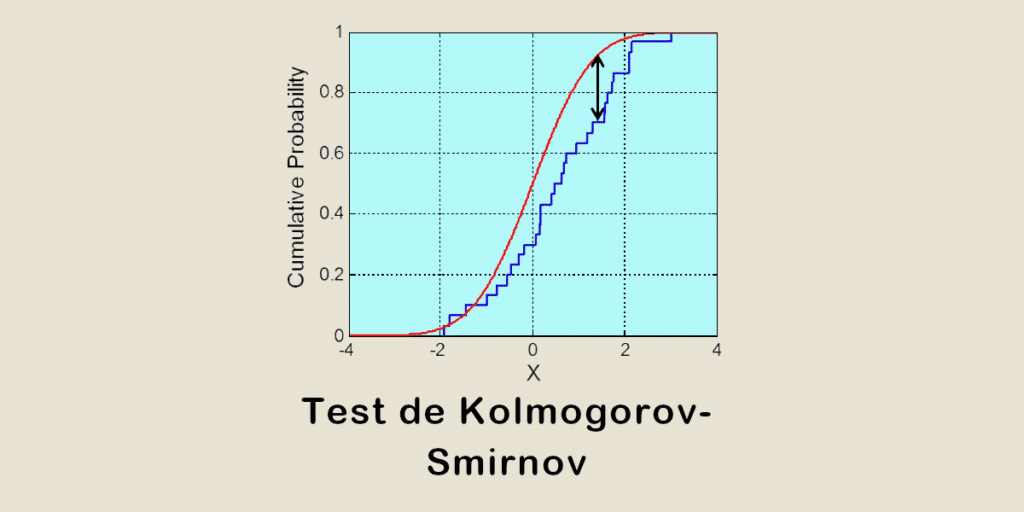
It is based on two key concepts: the ECD and the CTD. The ECD is the empirical cumulative distribution. It is constructed from observed data, and represents the proportion of observations less than or equal to a given value.
The TCD, on the other hand, is the theoretical cumulative distribution. It is based on a theoretical distribution specified by the user.
The aim of the test is to measure the maximum distance (test statistic D) between the TCD and the TCD. D is calculated by taking the absolute value of the greatest difference between the two cumulative distributions.
The higher its value, the greater the difference between the empirical distribution and the theoretical distribution.

To assess the significance of the test, a P value is calculated. It represents the probability of obtaining a value of D that is as extreme or more extreme than the one observed.
In addition, the null hypothesis states that the two distributions are identical and the alternative hypothesis suggests that there is a significant difference between the two.
This test can be used with a single sample to check whether the distribution follows a specific distribution, or with two independent samples to compare two different distributions.
If the P value is above a predefined significance level, the null hypothesis is verified. If it is lower, this proves that there is a difference and that the two distributions are incompatible.
What is the purpose of the Kolmogorov-Smirnov test?
The Kolmogorov-Smirnov test is used in many fields, including the social sciences, economics, biology, physics, engineering and many others.
One of the most common applications is to assess the normality of a distribution. An empirical distribution is compared with a theoretical normal distribution to check whether the data show any significant deviations.
This method can also be used to determine whether two independent samples come from the same population, or whether they differ significantly. This is very useful in comparative studies, controlled experiments or group analyses.
It is also used to check the adequacy of a statistical model. The aim is to check whether the model fitted to the data faithfully reproduces the distribution observed. If it does not, potential gaps or errors can be identified.
It is therefore a highly versatile tool for Data Science, Machine Learning and Artificial Intelligence. It is used not only to compare model performance, but also for feature selection and anomaly detection.
Conclusion
As well as highlighting the importance of encounters and chance in major scientific discoveries, this anecdote gave rise to a tool that is still widely used today to analyse data reliably.
To learn all the methods and tools of Data Science, DataScientest is the place to be. Our various training courses enable you to acquire all the skills needed to become a Data Analyst, Data Engineer, Data Scientist, Machine Learning Engineer or Data Product Manager.
In particular, you will learn about the Python language and its libraries, DataViz, Business Intelligence, data analysis and machine learning.
All our programmes can be completed entirely by distance learning, and our state-recognised organisation is eligible for funding options. Thanks to a partnership with MINES ParisTech, learners receive certification at the end of the course. Discover DataScientest!


