NetworkX is a very useful python library for modelling your data in the form of graphs. It also contains some classic graph theory algorithms (Dijkstra, PageRank, SImRank...) which we will present in this article.
What is a graph? Introduction to Graph Theory
A graph is a set of nodes (representing individuals, cities, products, text, images, etc.), and edges linking a subset of these nodes. The degree of a node in the graph is its number of neighbours (the vertices linked to it by edges).
Edges can be one-sided or symmetrical, so a graph can be directed or undirected.
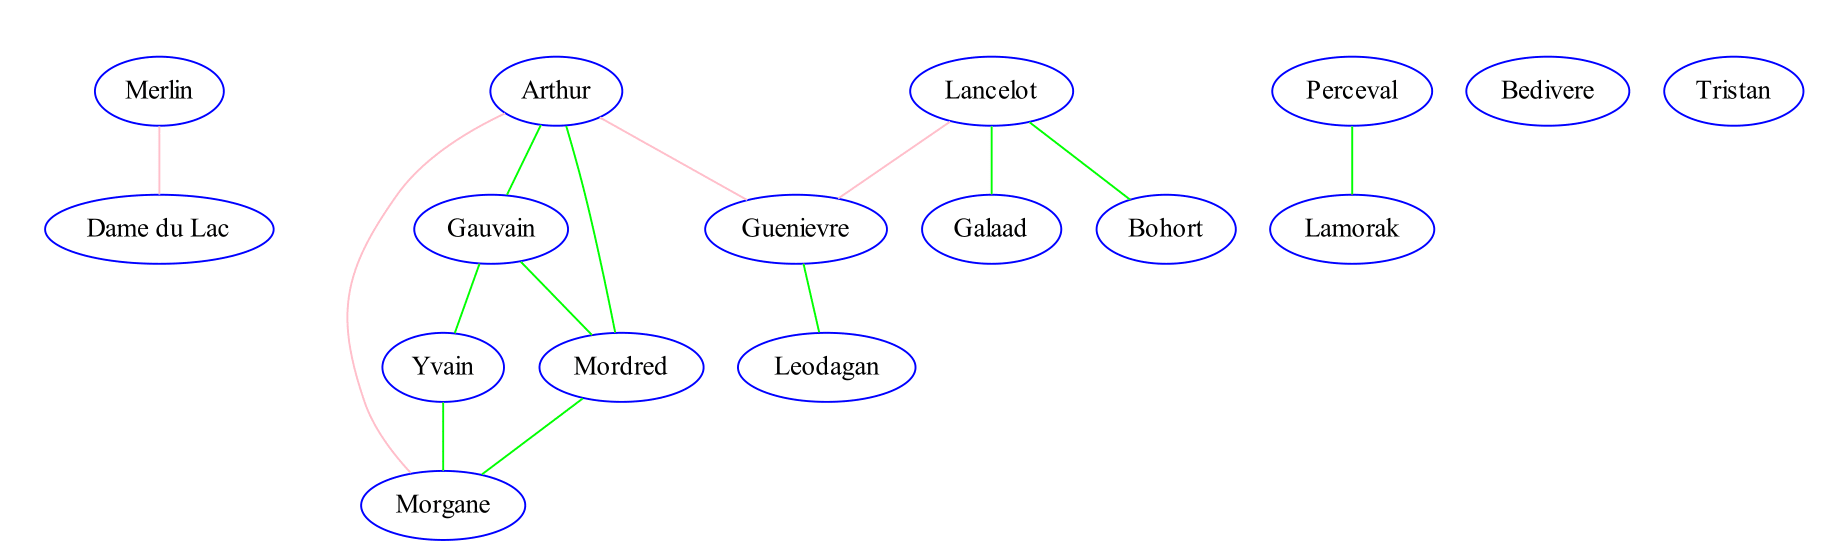
The undirected graph represents the relationships of kinship (green) and love (pink) between the main characters of the Round Table:
The following directed graph represents a list of tasks to be carried out to build a house:

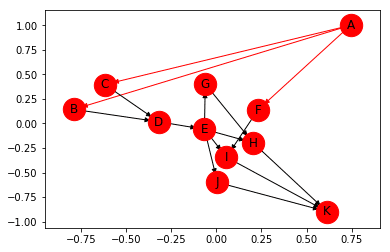
We can choose to weight the edges of a graph with weights modelling the cost or proportion of use of that path. For example, in the graph above, the cost of the edges would be the number of days needed to complete the task.
Applications :
Graph theory covers a vast range of applications: modelling networks (infrastructure, social, etc.), stock management, timetabling and their associated problems:
- How to establish the shortest/optimal itinerary: the problem of the travelling salesman.
- How to place infrastructure (electricity, fibre, etc.) in the best possible way? the problem of minimum coverage.
- How do you allocate rentals to customers or courses to learners without overlapping? the colouring problem.
Basic functions and main uses of NetworkX
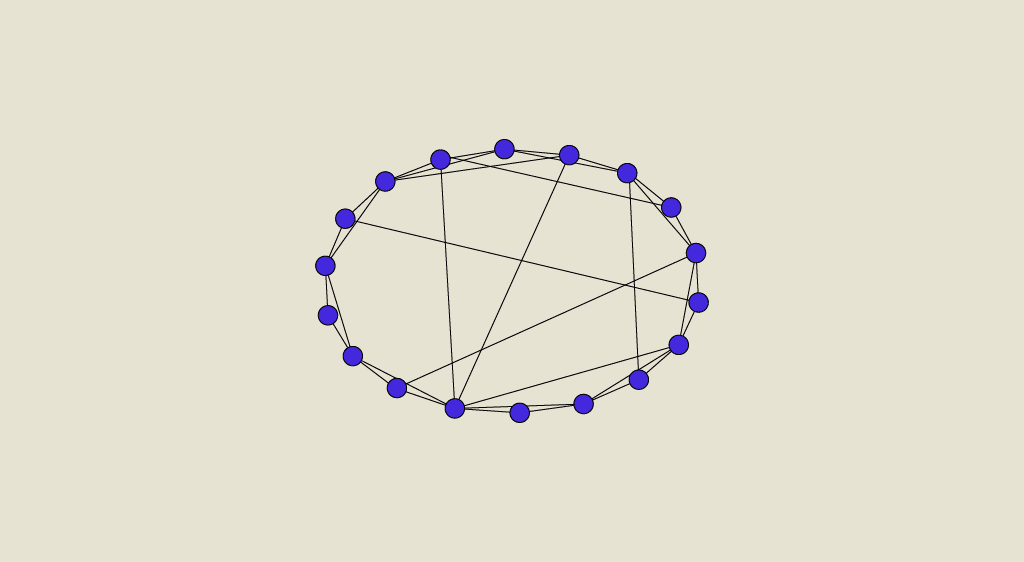
Construct our first graph:
The following code will build a graph, starting by adding its edges (g.addnode) and its nodes (g.add edge) (you can add several at once with the functions: g.add nodes from and g.add edges from), then display the graph created:
We can also quickly synthesise graph properties using NetworkX methods:
number of nodes with number_of_nodes, number of edges with number_of_edges
diameter = maximum distance between two nodes: diameter
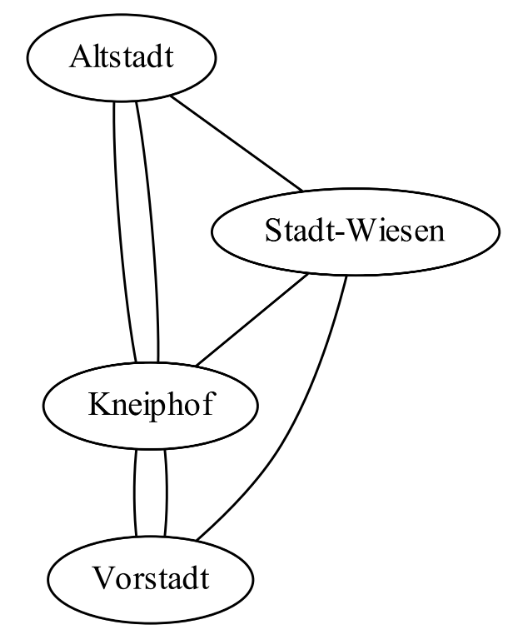
The Seven Bridges of Koenigsberg, what is this historical problem?
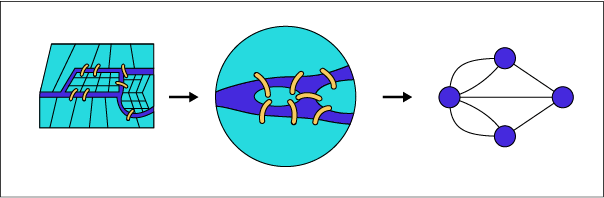
One of the first problems in graph theory was the Koenigsberg bridge problem. It was presented to the mathematician Euler in 1736 in the following form:
“Can we cover all 7 bridges in the city by crossing each bridge only once? Euler noticed that the order of the journey had no influence and modelled the problem in the form of a graph: the various districts being its nodes, linked together by the bridges, which are therefore the edges of the graph.
So what do you think the solution is?
If you arrive in a district via a bridge, you also have to leave it via (another) bridge. The number of arrivals in a district is therefore equal to the number of departures from that district. It follows that each neighbourhood must be linked to the others by an even number of bridges.
The solution to the problem therefore depends on the degree (number of adjoining neighbours/bridges) of the nodes: if they are all even, then a path exists that crosses all the bridges once, called an Eulerian path.
How do you find the shortest route with the Traveller's Problem?
Another classic graph-theoretic problem is that of the travelling salesman: the nodes of the graph are a set of towns or customers to be delivered to, while the edges are the road infrastructures, with a weight modelling the associated distance. The aim is to serve all the towns using the shortest route.
If the weights of the graph are positive (or at least if there is no cycle with a negative weight) a solution to this problem is given by Dijkstra’s algorithm, available via the function nx.shortest_path().
A smarter trainer than the others is trying to finish the adventure by taking the shortest possible route. The following script will enable him to reach the league in record time:
Minimum network coverage
The minimum spanning tree problem arises when a company wants to build a network (oil, fibre) connecting a set of households in the best possible way.
In the graph associated with this problem, the nodes are the customers to be connected, the edges are the set of possible infrastructure locations and the weights are their construction costs.
The aim is to determine the subset of edges connecting all the nodes that minimises the total cost, known as the minimum spanning tree.
NetworkX has a function that solves this problem: the Kruskal algorithm implemented in the nx.tree.minimum_spanning_tree method.
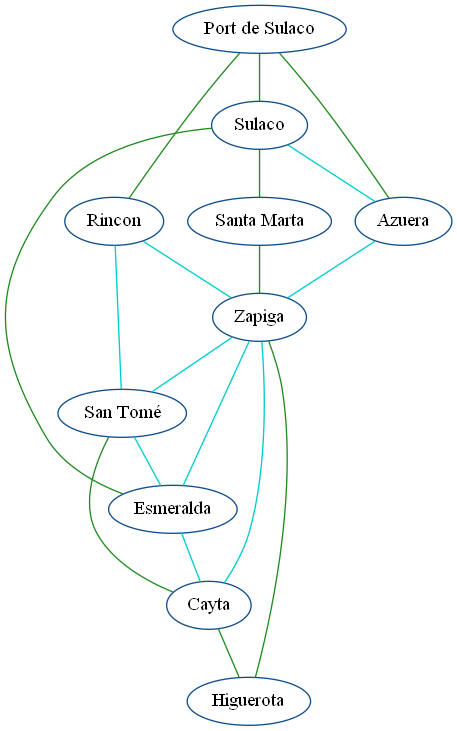
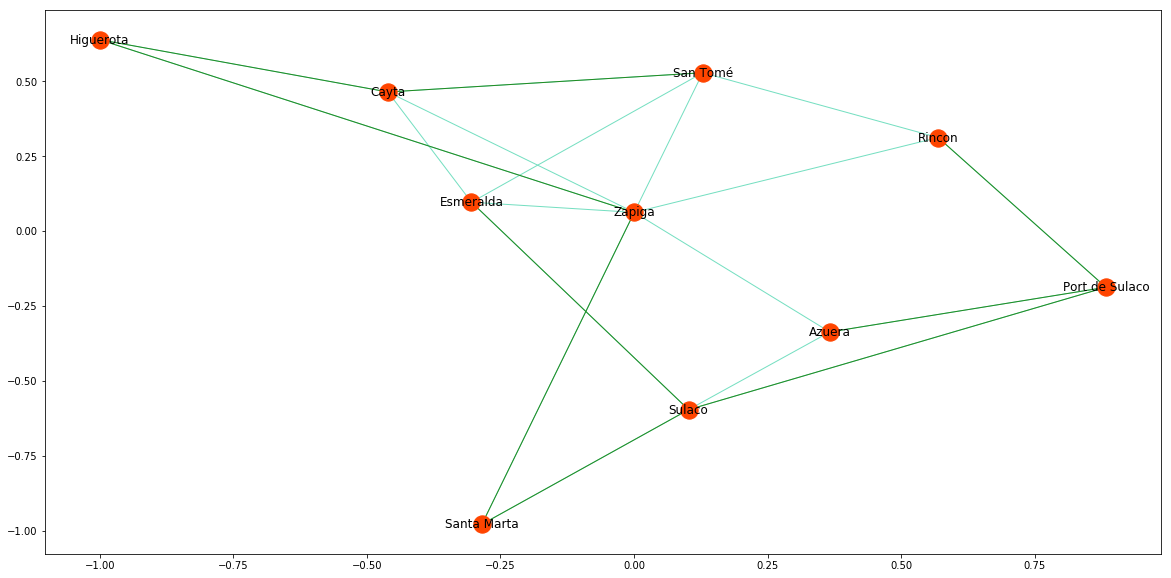
An industrialist wants to build a railway network in the fictitious province of Costaguana. He wants to connect all the towns but has a limited budget:
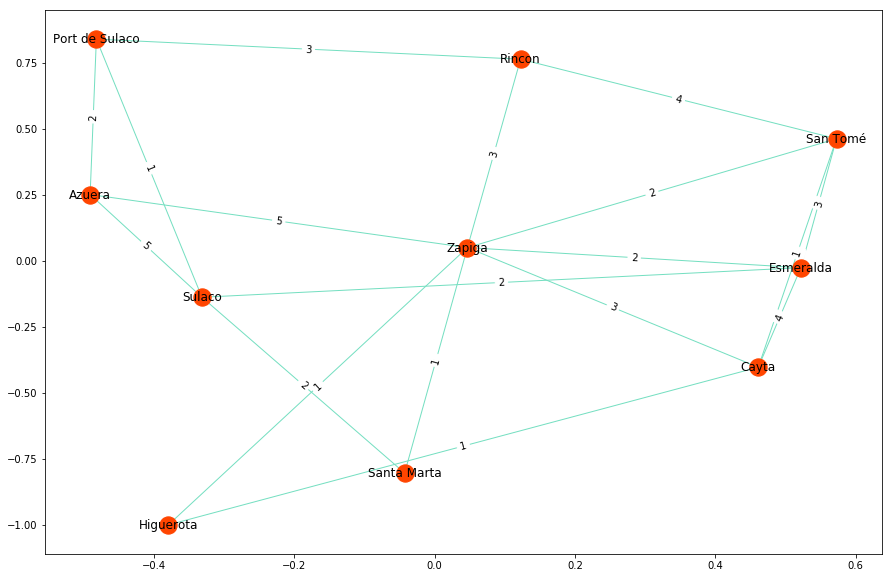
His problem will therefore be solved by displaying the minimal spanning tree associated with the graph (in green in the following images): the cost and number of edges saved can also be calculated:
Page Rank :
Page rank is an algorithm used by Google to calculate the popularity of web pages: those with the highest score are displayed first.
To measure this score, the web is represented by a graph in which the nodes are the websites and the edges are the hypertext links between the pages.
The principle is as follows: the initial scores of the graphs are uniform, we then go through the graph at random, jumping from one site to another at random (so we don’t take into account previously visited sites), and each time we go through a website we update its score.
At the end of the algorithm, the scores of the sites will be proportional to the probabilities of passage: the sites most visited by the random surfer/walker will have a high score.
One of the main problems with PageRank is its very high calculation cost. A related algorithm, SimRank, which calculates the similarity between web pages, is also implemented by NetworkX.
Conclusion
NetworkX covers a range of effective methods for a vast array of applications. Find out more about its applications in Data Science with our Machine Learning and Graph Theory with NetworkX module in our Data Scientist course.


