To analyze a set of numerical data, the mean is often used. However, this parameter has some shortcomings that do not always reflect the reality of the data. Fortunately, other statistical tools allow for a deeper analysis. This is notably the case with the standard deviation. So, what is it? What is its purpose? And how do you calculate it? The answers are here.
What is standard deviation?
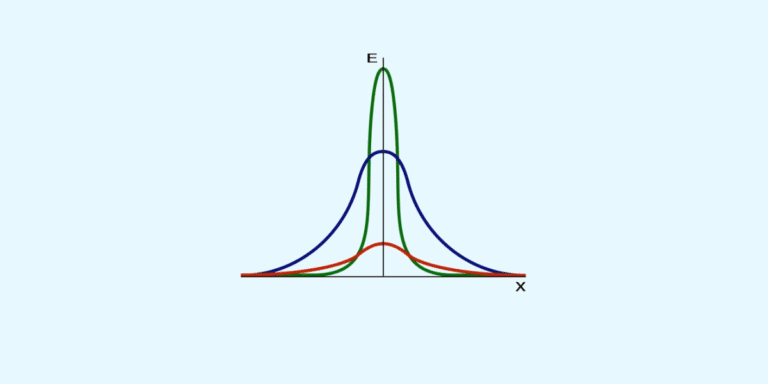
The standard deviation is a statistical tool used to measure the dispersion around the mean.
Indeed, the mean does not always reflect the reality of a set of numerical data.
For example, a company with a target audience having an average age of 35 years can represent different situations:
1. Only customers who are 35 years old.
2. Customers of all ages: 15, 25, 35, 45, and 55 years old.
In this context, it is the standard deviation, and not the mean, that helps specify the variations in age (or lack thereof). So, in the first situation, the standard deviation is 0.
This means that the dispersion among all customers relative to the mean is zero. However, in the second case, the standard deviation is 20.
This is, of course, a very simplistic example. But in reality, the standard deviation can be applied to a wide variety of situations, such as setting prices for a product launch, comparing employee salaries in a company, and more. For Data Analysts, this statistical tool must be mastered.

How do you calculate standard deviation?
Standard deviation calculation
The standard deviation is the square root of the variance. To know the standard deviation of a mean, we need to calculate the variance.
The formula is as follows
V=\left( \sum \left( x_{i}-\mu \right) ^{2}\right) /N
with i representing the distribution value, μ the population mean and N the population size.
Standard deviation =(V)²
Fortunately, there are simpler methods for calculating standard deviation.
Standard deviation in Excel
Excel offers several formulas for calculating standard deviation.
Standard deviation P
Calculating standard deviation in Excel is easy. Here’s how to do it:
- Select an empty cell;
- Type in the formula: =ECARTTYPEP(range of cells to be analyzed) ;
- Click on enter.
But be careful: with this formula, you’re assuming that the selected range represents all the values.
Standard deviation
If the data represent only a sample of the population, you can use the standard deviation formula.
The procedure is virtually identical:
Select an empty cell;
Type in the formula: =ECARTTYPE.STANDARD(range of cells to be analyzed) ;
Click on enter.
In addition to standard deviation, Excel lets you calculate mode, median, mean, range, coefficient of variation and more.

How do you interpret standard deviation?
Generally, the smaller the standard deviation, the more the values are concentrated around the mean, and vice versa. In this regard, a standard deviation without a mean may not necessarily be meaningful. Similarly, a mean without a standard deviation is not always very relevant.
To further enhance the interpretation of the standard deviation, you can calculate the coefficient of variation. This allows you to express what the standard deviation represents in the data series.
The formula for the coefficient of variation is as follows: standard deviation / mean. Know that a standard deviation begins to be significant when it represents half of the mean.
Things to remember
- The standard deviation measures the dispersion around the mean.
- The standard deviation is equal to the square root of the variance. Therefore, you need to calculate the variance to determine this measure.
- But the simplest way is to use an Excel formula to calculate the standard deviation.


