The problem of producing increasingly dynamic and intuitive maps is a major challenge for the digital transformation of the 21st century. The uMap editing and sharing software meets this need by creating a new, more dynamic way of creating maps that users can actively use.
Maps are the most appropriate solution for land navigation, and for centuries they have been used to find one’s way around increasingly dense and complex regions. So it’s only natural that, with the digitalisation and digitisation of our habits, the search for digitally efficient and increasingly dynamic maps has become a real challenge for the digital world of tomorrow.
What is uMap?
uMap is a free software application for editing and sharing that lets you quickly create an interactive, customised map, so that you can integrate it into a website, for example.
The software can give us maps like this one showing tourism in Bologna or this one giving information on the civil war in Syria.
The service can be installed locally, but most of the time it is used in a decentralised way, on remote servers thanks to sites such as Framasoft or OpenStreetMap France. In fact, the software is based on the services of the latter, with the data making up the base maps coming from this worldwide collaborative mapping project.
The maps created with uMap are made up of several layers that can be displayed as you wish, as well as markers placed on the chosen background map, which can be displayed with special interface options.
How do I use uMap?
Together we’re going to learn how to edit our first map on the instance of the software provided online by openstreetmap. First of all, you need to log on to http://umap.openstreetmap.fr/fr/, create an account so that you can find your various maps, and then log on to edit mode by clicking on “Create a map”. From here we can name our map, choose our background and add our first markers, lines and labels, whose shape and display method we can customise. It is also possible to create text tooltips containing images, videos or links.
The maps created in uMap also derive their dynamism from the use of layers on which the user can act differentially. All you have to do is create the different layers, organise their content by choosing the relevant data to be collected, and manage the order in which they are displayed or edited using the layer management panel.
Once our map has been edited and finalised, it’s time to publish it and control access to it. By opening the Export and share map panel, the software will provide us with a piece of html code, using the iframe tag (used to integrate the content of one web page into another).
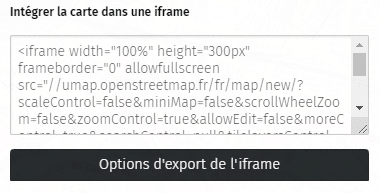
All we need to do is copy this text and integrate it into the html source code, giving us a final script that looks like the following:
Our map is finished and integrated into the site! You now know how to create an interactive dynamic map using intuitive, free software. There are many possible related applications, such as an interface for reading the data and predictions calculated by Descartes Underwriting, the start-up that uses data to predict natural disasters.
Interested in data prediction? Our Data Science training courses should appeal to you.


