The ROC (Receiver Operating Characteristic) curve and its associated metric AUC (Area Under the Curve) are essential tools for assessing classification models in machine learning. These metrics offer crucial insights into a model’s capability to differentiate between classes, particularly in binary classification scenarios.
The Fundamentals of ROC AUC
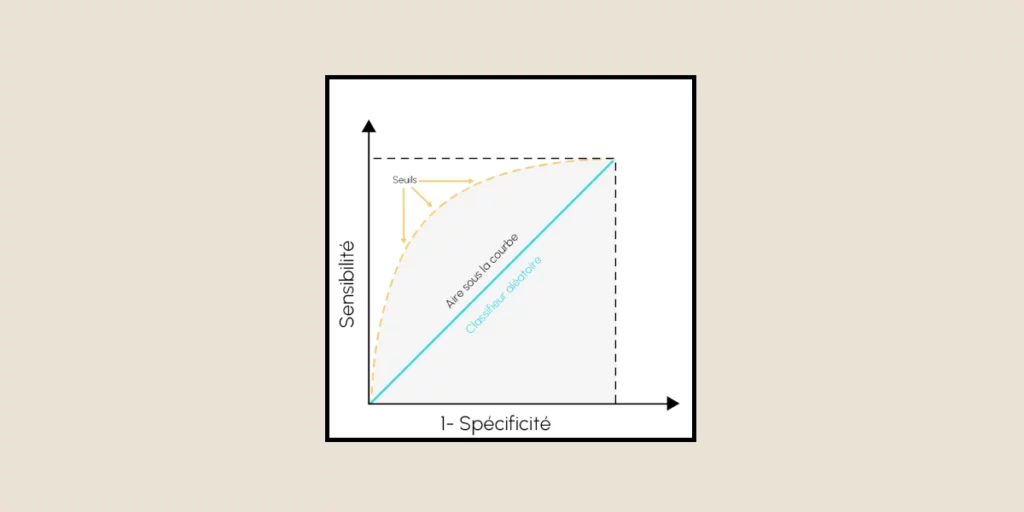
The ROC curve essentially serves as a graphical depiction that demonstrates the performance of a classification model across various decision thresholds. This curve maps the correlation between two key performance metrics: sensitivity (also referred to as the true positive rate) and specificity (the complement of the false positive rate). As the model’s decision threshold is adjusted, these rates vary, forming a curve that showcases the model’s ability to discriminate.
The area under this curve, termed the AUC, delivers a distinct scalar value that measures the model’s overall effectiveness. A flawless classifier attains an AUC of 1.0, whereas a random prediction results in an AUC of 0.5, illustrated by a diagonal line on the ROC graph.
Understanding Model Performance through ROC AUC
When appraising a classification model, the ROC curve offers significant insights into its performance attributes. The curve originates in the bottom-left corner (0,0) and stretches to the top-right corner (1,1). The route it takes between these points reflects the model’s skill in accurately identifying both positive and negative cases.

A notable benefit of the ROC AUC is its resistance to class imbalance. This trait makes it especially useful in real-world settings where one class might be vastly more common than the other. For instance, in medical diagnostics, where healthy patients largely outnumber sick ones, ROC AUC offers a balanced evaluation of model performance.
Practical Applications and Interpretation
In the realm of machine learning, ROC AUC fulfills several critical roles. It assists in model selection, parameter refinement, and contrast of various classification algorithms. This metric proves particularly beneficial when the best decision threshold is not predetermined or may require modification based on specific needs.
Consider, for instance, a medical diagnostic test: a high AUC indicates that the test can effectively differentiate between healthy and ill states. The ROC curve allows medical professionals to set a threshold that optimizes sensitivity (accurate detection of ill patients) and specificity (accurate detection of healthy patients) grounded on the relative costs of false positives and false negatives.
Advanced Concepts and Considerations
Although ROC AUC is chiefly linked with binary classification, it can be expanded to multi-class issues through different methods. A prevalent technique is the “one-vs-all” strategy, where individual ROC curves are generated for each class compared to all others.
The confusion matrix is pivotal in comprehending the ROC AUC. It offers the fundamental counts of true positives, true negatives, false positives, and false negatives that underpin the rates illustrated in the ROC curve.
Implementation and Tools

Contemporary machine learning frameworks furnish robust tools for calculating and visualizing ROC AUC. Libraries such as scikit-learn provide direct implementations through functions like roc_auc_score, streamlining the incorporation of this metric into model evaluation processes.
Best Practices and Limitations
While ROC AUC is a potent metric, understanding its limitations is crucial. It does not consider the differences in cost between false positives and false negatives, limiting its applicability in certain situations. Additionally, in extremely imbalanced datasets, supplementary metrics like precision-recall curves might offer better performance evaluation.
Practical Implementation Guide
A technical grasp of implementing ROC AUC calculations is vital for machine learning experts. The process starts with the predicted probabilities for each class. These probabilities are then ordered to produce varying threshold values, and for each threshold, the true positive rate and false positive rate are computed.
Performance Optimization Techniques
Several optimization strategies can be employed to enhance the use of ROC AUC in model evaluation. Feature engineering plays a vital role in boosting model performance. Moreover, the proper treatment of missing data and outliers can profoundly affect the shape of the ROC curve and the subsequent AUC.

Sector-Specific Applications
Different industries have distinct needs and considerations when applying ROC AUC analysis. In financial services, ROC curves are utilized to assess credit scoring models. The healthcare sector extensively uses ROC AUC in diagnostic tests. In cybersecurity applications, ROC AUC aids in evaluating anomaly detection systems.
Conclusion
The ROC AUC continues to be one of the most crucial metrics for evaluating machine learning models. Its capacity to provide an objective assessment of classifier performance across thresholds, along with its insensitivity to class imbalance, renders it an invaluable resource in a machine learning specialist’s toolkit. Understanding and accurately interpreting it are essential for developing effective classification models and making well-informed decisions about their implementation in practical applications.


