Have you heard of Grafana, the open source solution for analyzing and monitoring our online systems? Recently, its developers decided to abandon the Apache 2.0 license in favor of AGPLv3, an important piece of news that you're sure to be aware of.
But what else do you know about this data visualization platform? This article contains answers to all your questions.
What is Grafana and what is it used for?
Grafana is an open source tool for performing data analysis, obtaining metrics that make sense of huge amounts of data, and monitoring your applications with customizable dashboards. Being open source, it also lets you write plugins from scratch for integration with many different data sources.
Grafana connects to all possible data sources, commonly known as databases such as Prometheus, ElasticSearch, MySQL, PostgreSQL, Graphite, Influx DB and OpenTSDB.
💡Related articles:
The tool helps you study, analyze and monitor data over a period of time, technically known as time series analysis.
It allows you to track user behavior, application behavior, the frequency of errors that appear in a production or pre-prod environment, the type of errors that appear and contextual scenarios by providing relative data.
One of the great advantages of Grafana is that it can be deployed on site. This is advantageous for organizations that don’t want their data to be transmitted to a cloud provider for security and other reasons. Over time, this framework has grown in popularity and is deployed by big names such as PayPal, eBay, Intel and many others.
In addition to the fact that this solution is open source, the Grafana team offers two other services for businesses: Grafana Cloud and Grafana Enterprise.
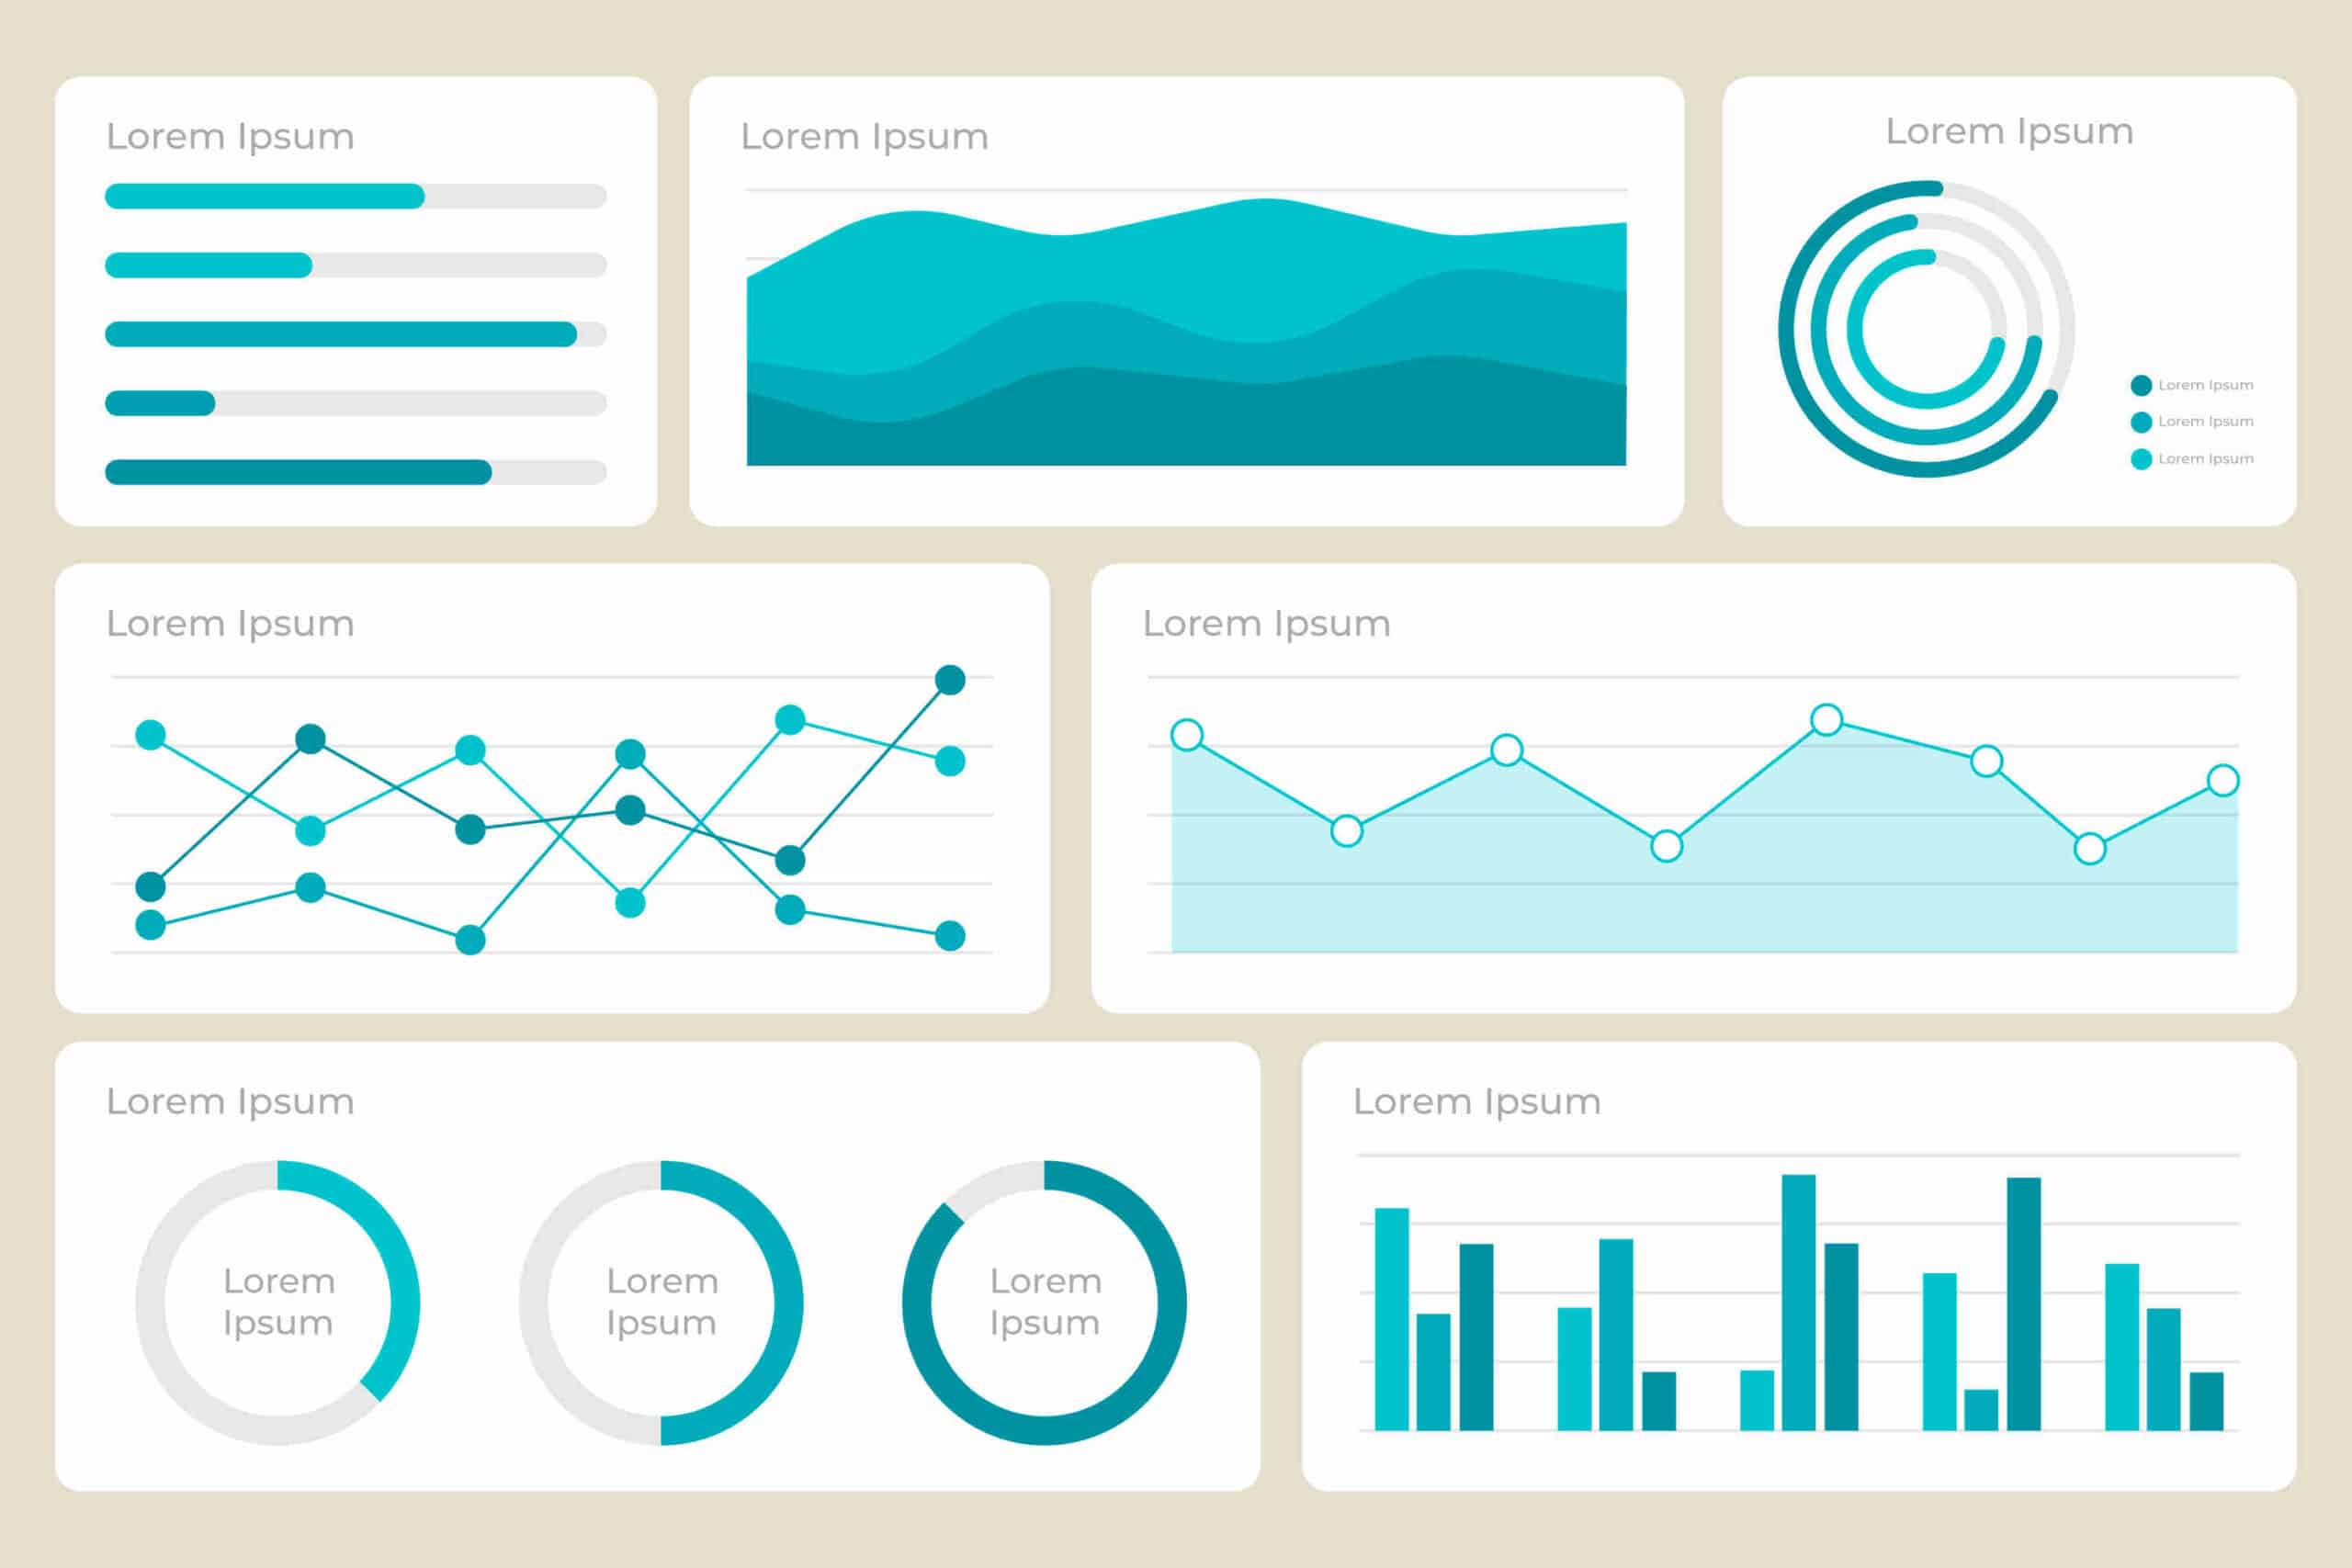
What are Grafana's dashboards?
Dashboards draw data from a connected data source such as Graphite, Prometheus, Influx DB, ElasticSearch, MySQL, PostgreSQL and so on. These are just a few of the many data sources Grafana supports by default.
Grafana’s dashboards contain a range of visualization options such as geographical maps, frequentation maps, histograms and all the variety of charts and graphs a company typically needs to study data.
Grafana’s dashboards offer several different individual panels on the grid. Each panel has different functionalities.
What features does Grafana offer?
Grafana is a feature-rich open source analytics dashboard platform.
This open source framework supports all your application’s analyses. You can easily query, visualize, set up alerts, understand data using metrics.
The dashboard is very well equipped and continually evolves to make sense of complex data, from graph displays to heat maps, histograms and geographical maps. The tool features a plethora of visualization options to understand data according to business needs.
Alerts are set up and triggered like tripwires when an anticipated scenario occurs. These events can be notified on Slack or any other communication platform used by the monitoring team.
Grafana has native support for around a dozen databases and many more facilitated by the respective plugins.
You can host it on site or on the cloud platform of your choice.
How do I use Grafana?
Like all data visualization platforms, Grafana is built around two core functions that help companies answer questions about users and events:
- Data tracking: Capture visits, events and follow-up actions through logs.
- Data analysis: Visualize data through dashboards and reports.
What is Grafana Cloud?
Grafana Cloud is an open, fully managed, highly available and natively cloud-based SaaS (Software as a Service) metrics platform. It is very useful for those who don’t want to take on the burden of hosting the solution on site, and who don’t want to have to worry about managing the entire deployment infrastructure.

What is Grafana Enterprise?
The Enterprise service includes all Grafana Cloud features plus premium plugins, data sources and premium support.


