Classification of unbalanced data is a classification problem where the training sample contains a strong disparity between the classes to be predicted. This problem is frequently encountered in binary classification problems, especially in anomaly detection.
This paper will be divided into two parts: The first one focuses on the choice of metrics specific to this type of data, and the second one details the range of useful methods to obtain a successful model.
Part I: Choosing the right metrics
What is an evaluation metric?
An evaluation metric quantifies the performance of a predictive model. Choosing the right metric is almost mandatory when evaluating Machine Learning models, and the quality of a classification model depends directly on the metric used to evaluate it.
About classification problems, metrics generally consist in comparing the real classes to the classes predicted by the model. They can also be used to interpret the predicted probabilities for these classes.
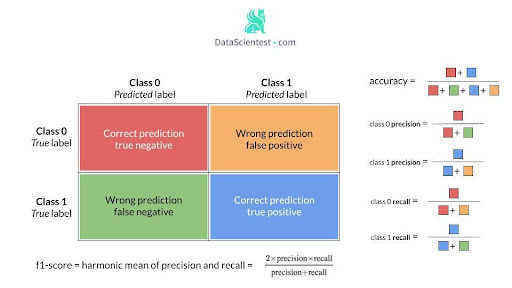
One of the key performance concepts for classification is the confusion matrix, which is a tabular visualization of the model predictions against the true labels. Each row of the confusion matrix represents the instances of a real class and each column represents the instances of a predicted class.
Let’s take the example of a binary classification, where we have 100 positive instances and 70 negative instances.
The confusion matrix below corresponds to the results obtained by our model:

It gives an overview of the correct and false predictions.
To summarize this matrix in a metric, it is possible to use the rate of good predictions or accuracy. Here it is equal to (90+57)/170 = 0.86.
The choice of an appropriate metric is not obvious for any Machine Learning model, but it is particularly difficult for unbalanced classification problems.
In the case of data with a strong majority class, classical algorithms are often biased because their loss functions try to optimize metrics such as the rate of good predictions, without taking in account the data allocation.
In the worst case, minority classes are treated as outliers of the majority class and the learning algorithm simply generates a trivial classifier that classifies each example into the majority class. The model will appear to perform well but this will only reflect the overrepresentation of the majority class. This is called paradoxical accuracy.
In most cases, the minority class represents the greatest interest and that we would like to be able to identify, as in the example of fraud detection.
The imbalance level varies but the use cases are recurrent: disease screening test , failure detection, search engine, spam filtering, marketing targeting…
Practical application: Churn Rate
Let’s assume that a service company wants to predict its churn rate.
Little reminder: the churn rate’s ratio is the following : lost customers / total number of customers, measured over a given period, usually one year.
The company wants to predict for each customer whether he will end his contract at the end of the year.
We have a dataset containing personal information and contract characteristics of each customer of the company for the year X, as well as a variable to know if he renewed his contract at the end of the year.
In our data, the number of ‘churners’ corresponds to 11% of the total number of customers.
We decide to train a first logistic regression model on our prepared and normalized data.
Surprise! Our code displays a good prediction rate of 0.90!
This is a very good score, but our goal is to predict the possible departure of customers. Does this result mean that out of 10 churners, 9 will be identified as such by the model? No!
The only interpretation that can be made is that 9 out of 10 customers have been well classified by the model.
To successfully detect naive behavior in a model, the most effective tool is always the confusion matrix.
A first look at the confusion matrix shows us that the good prediction rate obtained is largely influenced by the good behavior of the model on the dominant class (0).
In order to evaluate the model related to the desired behavior on a class, it is possible to use a series of metrics from the confusion matrix, such as precision, recall, and f1-score, defined below.
Thus for a given class:
- A high precision and a high recall -> The class has been well managed by the model
- High precision and low recall -> The class is not well detected but when it is, the model is very reliable.
- Low precision and high recall -> The class is well detected, but also includes observations of other classes.
- Low precision and low recall -> the class has not been handled well at all
The F1 score measures both precision and recall.
In the case of binary classification, the sensitivity and specificity correspond respectively to the recall of the positive and negative classes.
Another metric, the geometric mean (G-mean), is useful for unbalanced classification problems: it is the root of the product of sensitivity and specificity.
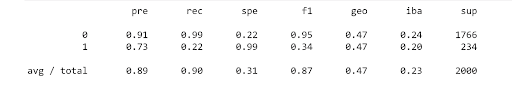
These different metrics are easily accessible thanks to the imblearn package.
The classification_report_imbalanced() function allows displaying a report containing the results on all the metrics of the package.
We obtain the following table:
The table shows that the recall and f1-score for class 1 are bad, while for class 0 they are high. In addition, the geometric mean is also low.
Thus, the trained model does not fit our data.
In Part II, we will discover methods that will allow us to obtain much better results.
You want to improve your skills to build efficient and reliable models from unbalanced data sets? Discover all our learning modules!


