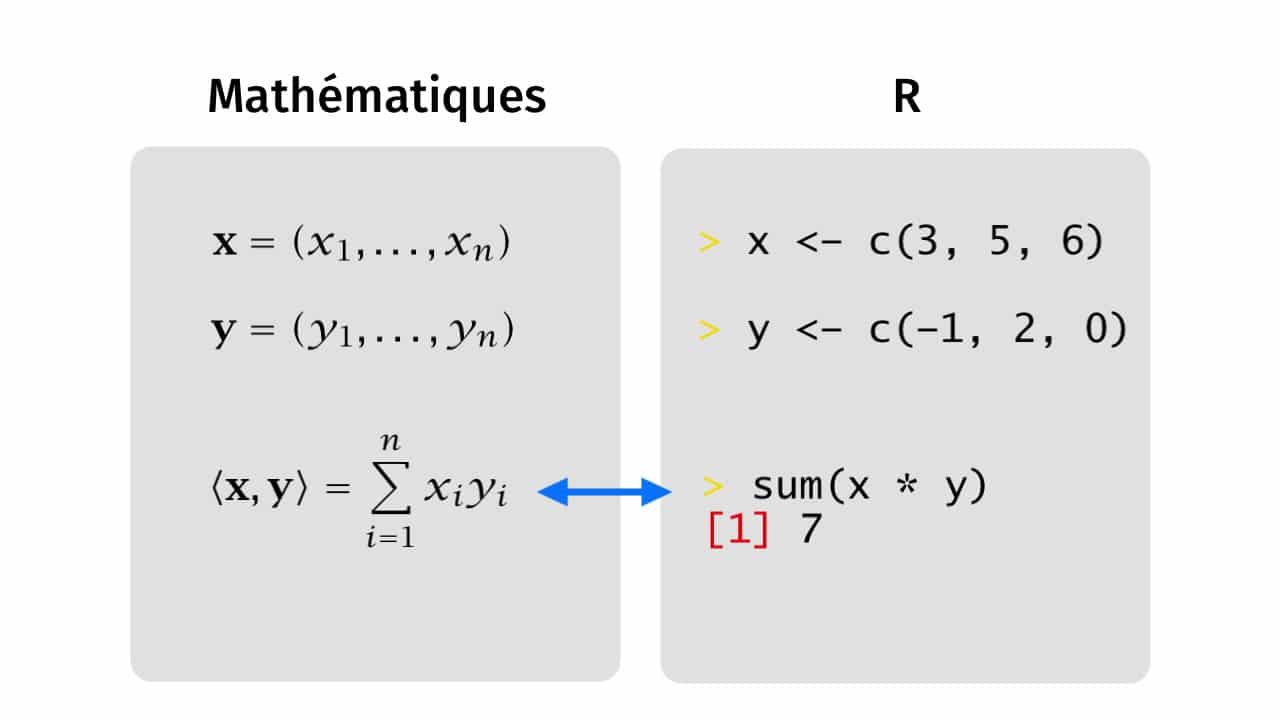
R is a recognized programming language in the world of Data Analysis and Data Science. In this article, we'll look at how it has established itself in the face of the ubiquitous Python, as well as its advantages.
What is the R programming language?
The programming language R is an essential open-source tool for statisticians and data analysts looking to explore, analyze, and visualize large quantities of data.
R was created in 1993 by Ross Ihaka and Robert Gentleman at the University of Auckland in New Zealand. It has since become one of the most popular languages for data analysis and visualization.
Similar to Python, R is an object-oriented language. This means that it allows users to create objects, such as matrices or arrays, which can then be used to store and manipulate data.
R boasts a powerful data import and export capability. It can seamlessly handle a wide range of data sources, including CSV files, SQL databases, Excel spreadsheets, and text files. R can also connect to online data sources, such as web APIs, to extract real-time data.
Another key feature of R is its library of packages, currently numbering over 15,000. These packages cover a broad spectrum of domains, including finance, biology, social network analysis, data visualization, and many others.
R is particularly renowned for its data visualization capabilities. Packages like ggplot2 and lattice offer advanced and highly customizable features.
Finally, R offers advanced data analysis capabilities. Packages such as dplyr and tidyr facilitate data manipulation and cleaning. On the other hand, packages like caret and mlr cover modeling and machine learning. R is also capable of handling geospatial data, thanks to packages like sf and rgdal.

What's the difference between Python and the R language?
The choice of programming language depends on the user’s needs. R and Python are two popular languages for data analysis and data science. Here is a comparison between these two languages:
Syntax: R is more concise and easier to learn for data manipulation and statistical modeling, while Python is more user-friendly for scripting and task automation.
Libraries: R has a vast library of packages for statistics and graphics. In contrast, Python is richer in machine learning, natural language processing (NLP), and computer vision.
Data Visualization: Overall, R excels in data visualization due to its ggplot2 library. Python also has its data visualization packages like Matplotlib, Seaborn, and Plotly, but they can be more complex to use.
Performance: Python is a faster language than R for calculations due to its simpler syntax and the ability to use scientific computing packages like NumPy, SciPy, and Pandas. However, R may be faster for specific tasks, such as processing large datasets.
Support and Community: Python has a larger and more active community than R, with many tutorials and online resources available. However, R has a highly active community dedicated to data analysis.
In conclusion, the choice between R and Python for data analysis depends on the specific needs of the user. If the emphasis is on statistics and data visualization, R is certainly a better option. If machine learning, computer vision, or natural language processing are priorities, Python is a better choice. However, many data scientists use both languages simultaneously to leverage the strengths of each.
If you are interested in training in data science or data analysis, please feel free to schedule an appointment with one of our advisors.


