In this article, we introduce you to 3 non-parametric statistical tests and when to use them, with supporting examples.
You might be familiar with the Student’s t-test, the Chi-square test, or the Fisher’s test, which are parametric tests. However, to use parametric statistical tests, we need to check certain assumptions about the data samples (such as equal variances between the two sample groups, the data following a normal distribution, etc.).
Sometimes, it’s not possible to verify these statistical assumptions or they are unverifiable. This is where we turn to non-parametric statistical tests!
Wilcoxon signed ranks test
This test corresponds to the non-parametric version of the Student’s t-test. In the case of the Student’s t-test, we require the data to be normally distributed, which may not always be the case. This is where this test comes into play!
Use Cases:
1. When you have a population and want to compare before and after measurements (e.g., evaluating the heart rate of a population before and after a medication injection).
2. When you have two paired samples (e.g., comparing the salaries of men and women of the same age for the same job).
In Python, you can use the `scipy.stats.wilcoxon` function from the `scipy` library with the `stats` module.
Example:
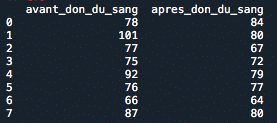
Let’s say we have data measuring the heart rate before and after blood donation for 8 randomly selected individuals. We record the data in the table below. We want to determine if the heart rate is lower after blood donation compared to before, which means we want to perform the test:
Null Hypothesis H0: “The heart rate is the same before and after blood donation.”
Alternative Hypothesis H1: “The heart rate is lower after blood donation than before.”

Mann Whitney test
It is the non-parametric version of the Student’s t test for two independent samples. It is also known as the Wilcoxon rank sum test or the Wilcoxon-Mann Whitney test.
Use cases :
For independent samples. (Comparing the scores of two classes)
On python, use the scipy.stats.mannwhitneyu function in the scipy library with the stats module.
Example:
A railway company wants to compare the number of delays for two types of train: A trains and B trains. The table below lists the number of delays for each train, according to whether they are A or B trains. The question is whether one of the two train types tends to have higher values than the other.
The null hypothesis Ho: “Delays for both train types are similar” and the alternative hypothesis H1: “One of the two train types has more delays than the other”.
Kruskal Wallis test
This test corresponds to the Mann-Whitney test for more than two samples, and can be considered as the non-parametric version of Anova (statistical models that show whether groups belong to the same population).
Use case :
Compare wheat production on 4 independent plots.
Example:
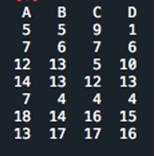
The railway company wants to compare the number of delays now experienced by four types of train: A, B, C and D trains. The table below lists the number of delays for each type of train. Our aim is to determine whether there are significant differences in delays between the different train types.

The null hypothesis Ho: “All train types have similar delays” and the alternative hypothesis H1: “One train type has more/fewer delays than the others”.
On python, we use the scipy.stats.kruskal¶ function of the scipy library with the stats module.
In conclusion, when the statistical hypotheses for parametric tests cannot be verified or are not verified, a non-parametric test can be applied. Non-parametric tests are more robust and can be applied in many situations, but are generally less powerful than parametric tests. If you’d like to find out more about statistical testing, there’s a module devoted to it in our Data Analyst or Data Scientist training course.


