
Data Visualization, often called “Dataviz”, is the set of techniques that allow the visual transformation and the synthesis of raw data to make them speak.
Where does the concept of Data Visualization come from?
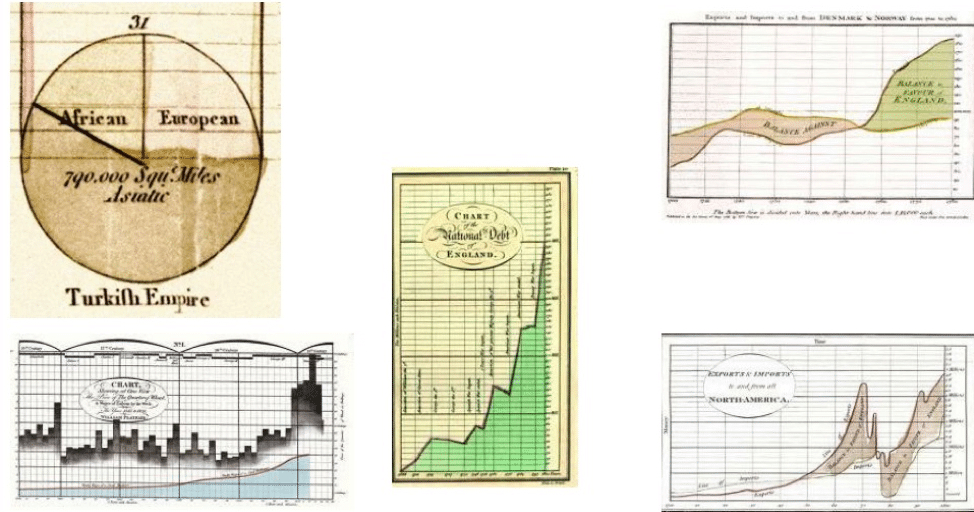
Dataviz is a process of transmitting information that goes back several centuries.
In the 18th century, the engineer and economist William Playfair invented the histogram, the pie chart, and the time series, 3 simple types of graphs still widely used today.
Today, Dataviz is present everywhere, whether it is in the latest Analysis report of your website or the most mainstream media. It is also a powerful communication tool that can be put to good use in Data Science.
Let’s imagine that you have just completed an exhaustive analysis of a database containing the purchases and characteristics of many consumers. During your analysis, you must have noticed a lot of useful information, for example, the impact of the promotion strategy decided by your company. You must have defined performance indicators to give credibility to your analysis. So you end up with a lot of figures that are difficult to understand for everyone.
How can you summarize your analysis in an intelligible and clear manner without using indigestible tables of figures?
This is where Dataviz comes in. Data visualization will offer you a set of techniques allowing the transformation of raw and often complex data into accessible visual representations to make them quickly understandable to the greatest number of people.
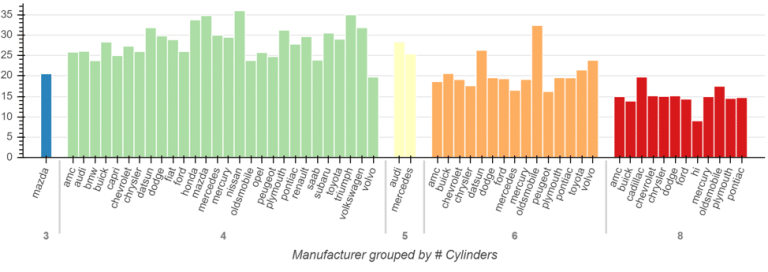
By using graphs such as pie charts or histograms you will be able to synthesize and organize your analysis.
Moreover, access to data becomes faster, and more relevant and makes the data sharing easier and use easier by different branches.
You will be able to tell the story of your analysis, using what we call storytelling. Better than illustrating, you need to unfold, using the tools offered by dataviz, the steps of your reasoning until the conclusion.
How to do Dataviz with Python?
Python has emerged as the go-to language in recent years for exploring and analyzing data sets.
One of the advantages of Python is that you can use the same free and open-source language for many data science tasks such as data mining, statistical analysis, machine learning, and data visualization.
Matplotlib is the first Python library that allows you to generate and manage several types of graphs, in a fairly simple and orderly way.
It is also the most used in Data Science with Python, and the most common in Data Vizualization training.

Many other libraries, based on Matplotlib, have been created to modernize graphics and make their creation even simpler.
This is the case of Seaborn, very appreciated for its statistical graphics and its disconcerting simplicity.
This library is used in addition to Matplotlib. For the advanced management of the design of your graph, titles, frames, and axes, Matplotlib will be indispensable while Seaborn will be more appreciated for its aesthetics.

More recently, the appearance of libraries such as Plotly or Bokeh, make it possible to create high-level interactive graphics, which are easily integrated into a web page, without needing to master JavaScript.
There are many other tools, such as Dash which allows you to create dashboards and web applications with your graphs.
All these packages have the advantage of being very well-documented and easy to use (provided that you have worked on your data beforehand). They will allow you to display and save good-level graphs synthesizing efficiently the information of your dataset according to the message you want to put across.
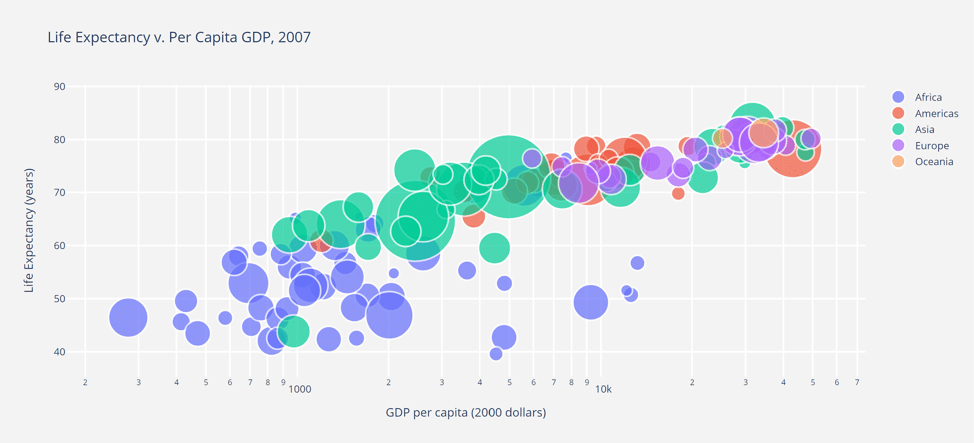
You will be able to display up to 4-5 pieces of information easily in the same graph, and with 2 lines of code, with some of Seaborn’s functions.
For a web application containing several interactive graphs, you will need a longer code, it’s up to you to define the investment that will suit you depending on the expected result.


