Clustering is a specialized discipline within Machine Learning aimed at separating your data into homogeneous groups with common characteristics. It's a highly valued field, especially in marketing, where there is often a need to segment customer databases to identify specific behaviors. The K-means algorithm is a well-known unsupervised algorithm in the realm of Clustering.
In this article, we will delve into its operation and the useful means to optimize it.
This algorithm was designed in 1957 at Bell Labs by Stuart P. Lloyd as a technique for pulse modulation and coding (MIC). It was only introduced to the general public in 1982. In 1965, Edward W. Forgy had already published an algorithm that was nearly identical, which is why K-means is often referred to as the Lloyd-Forgy algorithm.
Its applications are diverse: customer segmentation, data analysis, image segmentation, semi-supervised learning, and more.
The Principle of the K-means Algorithm
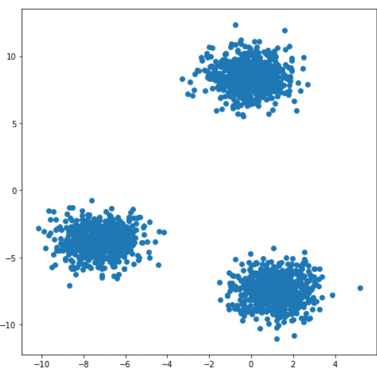
Given a set of points and an integer k, the algorithm aims to divide the points into k groups, called clusters, that are homogeneous and compact. Let’s look at the example below:
On this 2D dataset, it becomes clear that it can be divided into 3 groups.
How do we go about it?
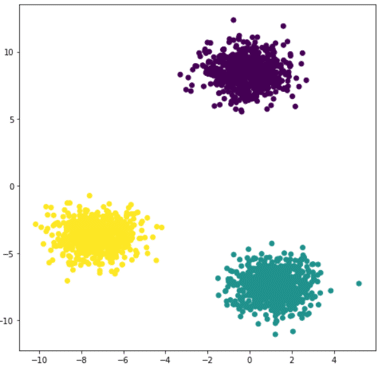
The idea is quite simple and intuitive. The first step is to randomly define 3 centroids and associate them with 3 labels, for example, 0, 1, 2. Then, for each point, we calculate its distance to the 3 centroids and associate the point with the closest centroid and its corresponding label. This labels our data.
Finally, we recalculate 3 new centroids, which will be the centers of gravity of each labeled cluster of points. We repeat these steps until the new centroids no longer move from the previous ones. The final result is shown in the figure on the right.
Concept of distance and initialisation
You’ve understood that in this algorithm, two key points are: What metric is used to evaluate the distance between points and centroids? What is the number of clusters to choose?
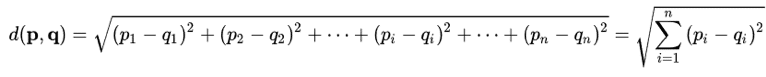
In the k-means algorithm, the Euclidean distance is generally used, where p = (p1,…,pn) and q = (q1,…,qn).
It allows you to assess the distance between each point and the centroids. For each point, we calculate the Euclidean distance between that point and each of the centroids, then associate it with the closest centroid, which is the one with the smallest distance.
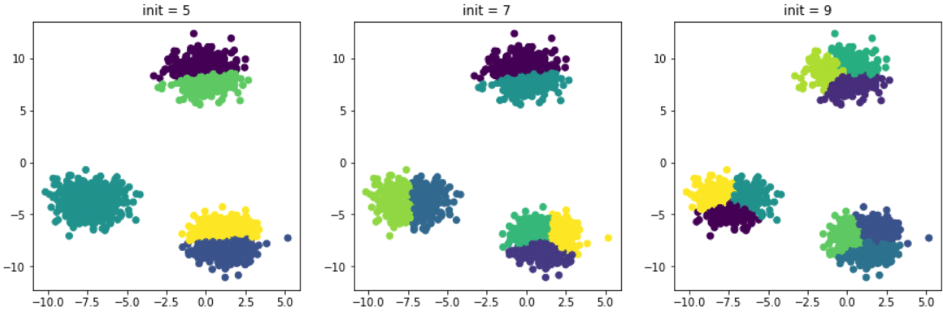
In the previous example, it was easy to find the ideal number of clusters by visualizing it graphically. Generally, datasets have more than two dimensions, making it difficult to visualize the point cloud and quickly identify the optimal number of clusters. Let’s assume in the previous example that we didn’t visualize the data beforehand and decided to test it several times with different initial numbers of clusters. Here are the results obtained:
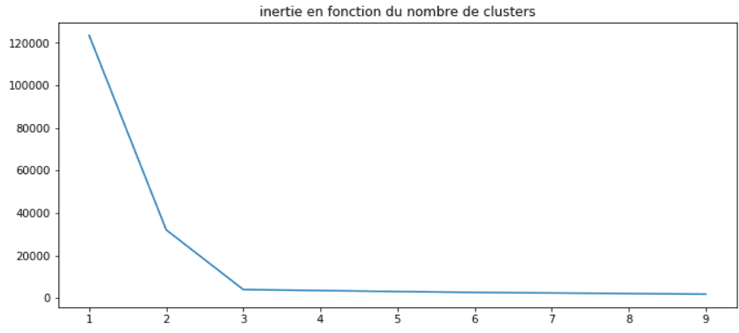
The partitioning is inaccurate because the initial number of clusters is much higher than the ideal number, which in this case is 3. There are methods to determine the ideal number of clusters. The most well-known one is the elbow method. It relies on the concept of inertia, which is defined as follows: the sum of the Euclidean distances between each point and its associated centroid. Naturally, the higher the initial number of clusters we set, the lower the inertia becomes: points are more likely to be close to a centroid. Let’s see how this works on our example:
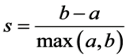
We can see that the inertia levels off from 3 clusters. This method is conclusive. It can be coupled with a more precise but computationally intensive approach: the silhouette coefficient. It is defined as follows:
a. The average distance to other observations in the same cluster (i.e., the intra-cluster average).
b. The average distance to the nearest cluster.
This coefficient can vary between -1 and +1. A coefficient close to +1 means that the observation is well inside its own cluster, while a coefficient close to 0 means it is close to a boundary; finally, a coefficient close to -1 means that the observation is associated with the wrong cluster.
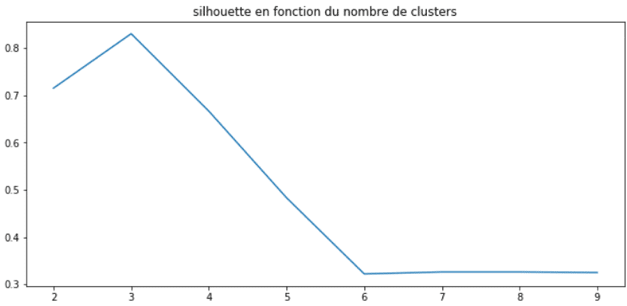
As with inertia, it is wise to display the coefficient’s evolution based on the number of clusters as shown below:
This method also helps identify the ideal number of clusters, which in this case is 3.
In addition to these two methods, it is essential to conduct a detailed analysis of the created clusters. By that, I mean a precise and in-depth descriptive analysis to determine the common characteristics of each cluster. This will allow you to understand the typical profiles of each cluster.
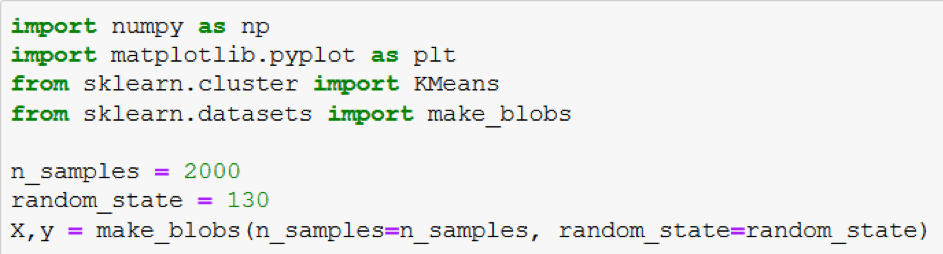
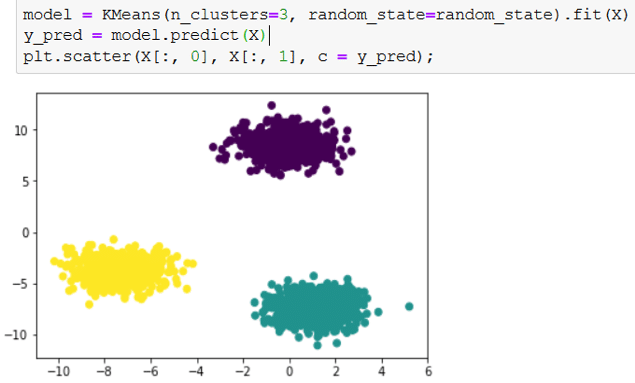
Training a K-means algorithm is made easier with the Scikit-Learn library. Our example dataset, which was used for illustration, can be created easily using Scikit-Learn’s make_blobs function. Here’s how to implement it in code:
Now that we have our dataset, we can proceed with the implementation of K-means. We will use the Scikit-Learn library and visualize the result:
The `n_clusters` attribute of the Scikit-Learn’s KMeans class allows us to set the number of centroids we want. Therefore, it also defines the number of initial centroids.
By default, this class doesn’t use a random initialization method but rather a method developed in 2007 by David Arthur and Sergei Vassilvitskii called K-Means++. It involves selecting distinct centroids from each other, reducing the risk of converging to a non-optimal solution. The default distance used is, of course, the Euclidean distance defined earlier.
The limits of the k-means algorithm
Indeed, as we’ve seen, the algorithm requires defining the number of clusters beforehand. This requires having a precise idea, and even if we’ve seen two complementary methods to optimize on certain datasets, they are not infallible.
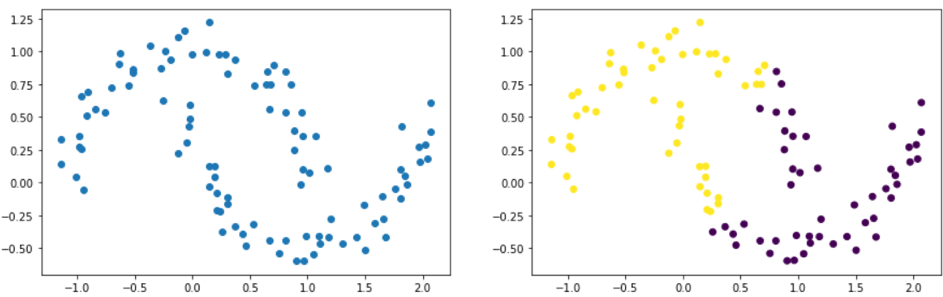
Indeed, datasets with elliptical shapes, for example, can pose a problem. In the example below, we clearly see two groups resembling two ellipses. The figure on the right shows the result after using the K-means algorithm. It’s evident that it failed to identify our two ellipses.
Using a clustering algorithm like the K-means algorithm is not straightforward depending on the data you have. You will often need to preprocess the data.
At Datascientest, we teach you how to master the main clustering algorithms and how to interpret them on datasets. Feel free to explore our training offers and apply for one of them to discover clustering as well as many other areas of Machine Learning.