DAX Studio: everything you need to know about the DAX language query analysis tool

Les outils analytiques modernes comme Power BI sont conçus pour délivrer des résultats d’analyse de façon rapide et dynamique. Toutefois, un problème dans le modèle de données ou des calculs trop complexes peuvent ralentir la production du rapport. The DAX language is at the heart of Microsoft Power BI and the Power Platform. It is […]
COUNT() function in SQL : Full tutorial on this formula
Do you work with tables and want to know the number of elements in a column or with a filter? The COUNT() aggregation function in SQL can be used to count the number of records in a table. This function is particularly useful if you want to know the number of users online or the […]
ChatGPT: How does this NLP algorithm work?

You’ve probably heard of ChatGPT, the tool that can answer all your questions in real time? Launched at the end of 2022, it looks set to revolutionise the field of artificial intelligence. We tell you all about it! ChatGPT (Chat Generative Pretrained Transformer) was developed in November 2022 by the US company OpenAI. It is […]
Decoding HDFS: Unveiling the Core of Hadoop Distributed File System

The acronym HDFS stands for Hadoop Distributed File System. As its name suggests, HDFS is closely linked to the Hadoop tool. What is HDFS used for? What is the link between HDFS and Hadoop? How does HDFS work? We’ll answer all these questions in this article. What is Hadoop? Hadoop is an open-source tool that […]
Data Sources: Understanding the Definition and Inner Workings

Fake news! This term has been in fashion for some years now. It’s all about the reliability of information. And that’s precisely why data sources are so important. While in the world of journalism, this refers to the origin of the information, in the world of data expertise, data sources correspond to storage locations that […]
Data Wrangling: Uncover the Power of Refining Raw Data for Informed Insights

Data wrangling involves preparing data so that it can be analysed. This process is an essential step in Data Science, and requires specific skills and tools. Find out everything you need to know! Today’s businesses collect a great deal of data, particularly on the web. By using this data to make strategic decisions, they can […]
The Impact of the DIKW Pyramid on Corporate Success

The DIKW pyramid is a management concept that can prove useful in companies, and particularly for IT teams. What is DIKW? 1. Datas: the data Datas are unorganised data which, when grouped together without any particular context, do not necessarily have any link between them if they are not analysed. This can take the […]
Navigating Data Drift: Strategies to Tackle Shifting Data Landscapes
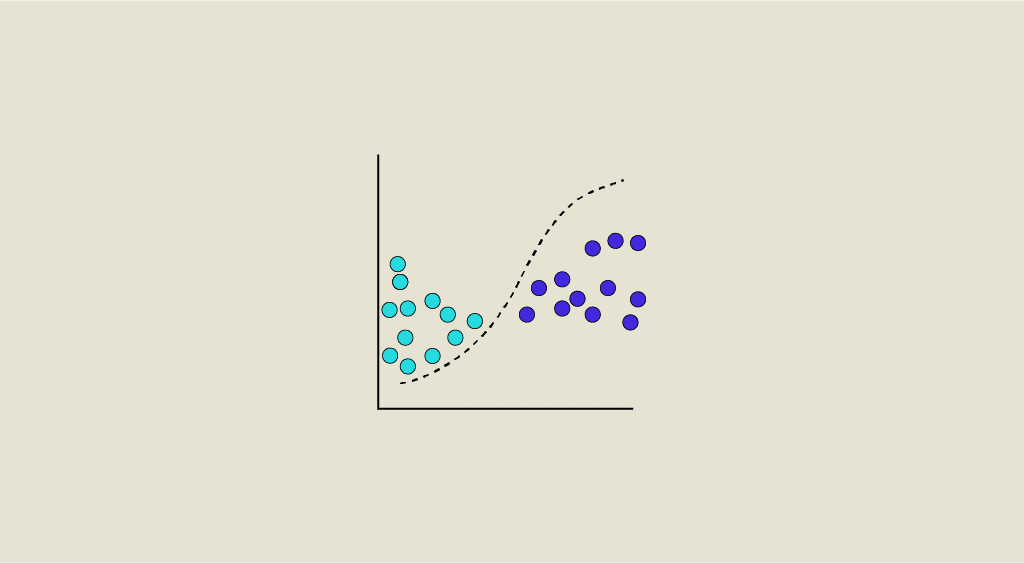
Data drift occurs when the data on which the model is run differs too greatly from the training data. This problem must be detected and anticipated, as it degrades prediction performance over time. Find out all you need to know about data drift: definition, dangers, solutions… Machine Learning involves using available data to train a […]
Mastering Control Flow: The Power and Versatility of the For Loop in Programming

What is a “for loop”? In programming, iterables are used to designate objects that group together a collection of objects that can be browsed. Iterables include lists, tuples, dictionaries and strings, to name but a few. For loops are used to browse iterables and repeat a sequence of instructions for each element The code to […]
Maximizing Data Connections: The Power BI RELATED Function
The Power BI RELATED function allows you to retrieve a column from a data table. Find out everything you need to know about this DAX function and how to take a training course to become a Power BI data analysis expert… With over 5 million users, Microsoft’s Power BI software dominates the Business Intelligence platform […]
Pie Chart Excel: Mastering Data Visualization
Series of data spread over several rows often lack legibility. To make it easier to interpret the information in an Excel table, it’s best to create graphs or an Excel pie chart. With Microsoft, you can present data in a variety of ways: scatter plots, histograms, stacked bars and, of course, in an Excel pie […]
NetworkX: Graph theory, basic functions and use

NetworkX is a very useful python library for modelling your data in the form of graphs. It also contains some classic graph theory algorithms (Dijkstra, PageRank, SImRank…) which we will present in this article. What is a graph? Introduction to Graph Theory A graph is a set of nodes (representing individuals, cities, products, text, images, […]
