Data drift occurs when the data on which the model is run differs too greatly from the training data. This problem must be detected and anticipated, as it degrades prediction performance over time. Find out all you need to know about data drift: definition, dangers, solutions...
Machine Learning involves using available data to train a model to recognise, predict or reproduce that data. However, things can get complicated when the model is deployed during the production process.
Let’s take the most common case of supervised learning: the training data is labelled and this is what helps our model quantify its errors when training on past data… However, once the model is deployed, the data to be predicted is current data and therefore has no label.
Regardless of the model’s level of accuracy, predictions can only be relevant if the data submitted to the model in production is similar or statistically equivalent to the data used for training. If this is not the case, the phenomenon of “data drift” occurs.
What causes data drift?
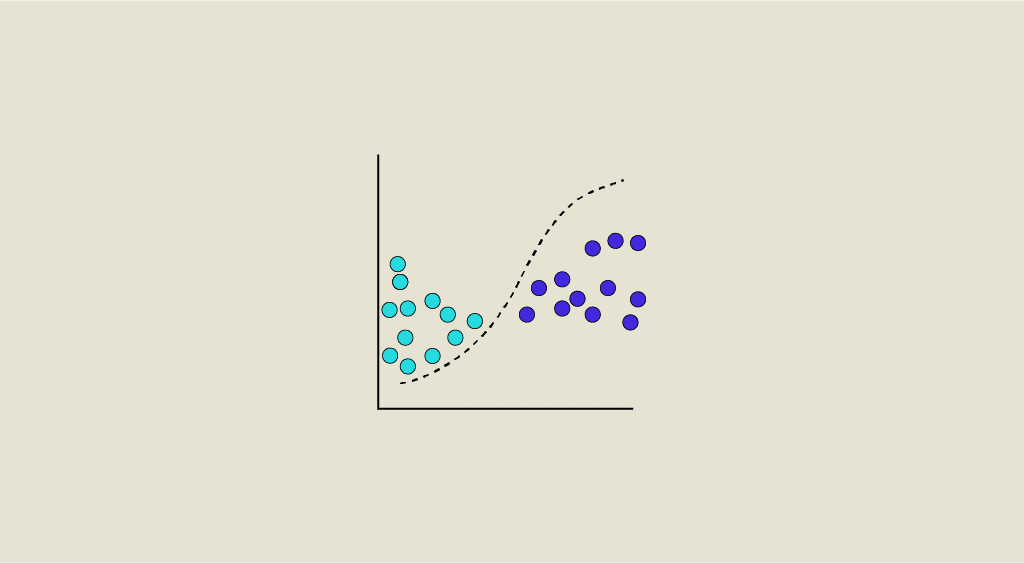
Data Drift is a variation of real-world data from the data used to test and validate the model before deploying it in production.
Many factors can cause data drift. One of the main causes is the time dimension, as a long period can elapse between the time when the training data is collected and the time when the model trained on this data is used for prediction from the real data.
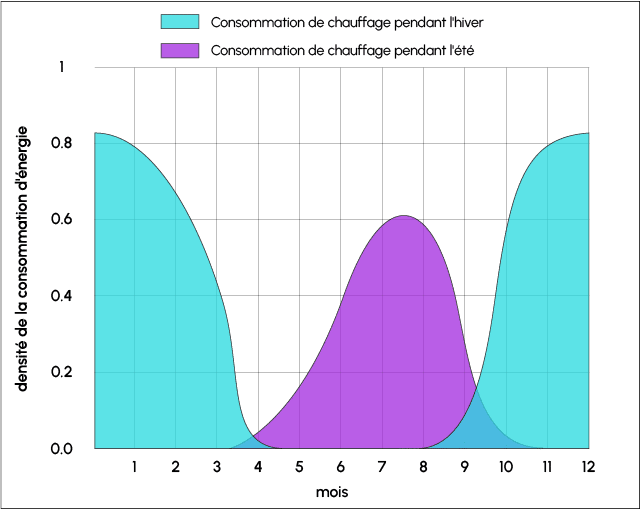
Another common cause of data drift is seasonality. Some of the data collected during the summer can be very different during the winter, if the temperature or the length of the day has an impact on it, for example.
Similarly, data collected before an event will not necessarily be valid afterwards. For example, much of the data collected before the emergence of Covid is now obsolete. If a Machine Learning model is trained on this data and tested on current data, a data drift problem will most likely arise once it has been deployed.
Another example: A Computer Vision model trained on a dataset linked to European roads will not be suitable for roads in the United States. The choice of training data is therefore extremely important.
What are the risks of Data Drift?
If a data drift is not identified in time, the model’s predictions will be wrong. The decisions taken on the basis of these predictions will therefore have a negative impact.
For example, if your tastes have changed and Netflix doesn’t have access to your most recent data, its model is likely to suggest films that you won’t like, or at least won’t like any more.
This example is not very worrying, but the consequences can be much more serious. For example, a trader misdirected by a data drift can invest colossal sums in a share with no current value.
Depending on the nature, extent and type of data drift, the effort required varies. Sometimes it is possible to solve the problem by re-training the model on new data. However, it may also be necessary to start from scratch.
In addition to the data, the model itself can also drift. This is the case, for example, of a model used before Covid to predict which students will opt for online courses. If used during the Covid crisis, this model would be completely useless.
This is known as “Concept Drift”. This problem can be solved through e-learning, by re-training the model on each observation.
It is important to build a reusable process for identifying data drift. You can also define thresholds for the percentage of drift not to be exceeded, or configure an alert system to take the necessary action before it’s too late.
Data drift can be detected from the evolution of the data itself, or when the model’s predictions are incorrect.
However, incorrect predictions can only be identified if a manual method of finding the correct label is available.
How do you detect Data Drifts?
When deploying a Machine Learning model, it is important to regularly monitor its performance. Let’s take the example of a Computer Vision model built from a dataset of 100 different dog breeds.
To check whether its performance is decreasing due to data drift, it is necessary to review all the new images and predictions ingested by the feedback loop system. The predictions must then be examined, edited or validated.
By comparing the initial predictions with the edited predictions, it is possible to check whether or not performance is better than average. However, in order to validate all the predictions in real time, it is necessary to entrust access to the data to a large number of people. A large workforce is therefore required for this operation.
Data Drifts can be identified using sequential analysis methods, model-based methods, or methods based on temporal distribution.
Sequential analysis methods such as DDM (Drift Detection Method) or EDDM (Early DDM) detect drift based on a fixed error rate.
A model-based method, on the other hand, uses a customised Machine Learning model to identify drift, by determining the similarity between a point or group of points and a reference baseline.
Data that has been used to build the current model in production needs to be labelled as ‘0’, and real-time data needs to be labelled as ‘1’.
A model is then built to evaluate the results. If the model is highly accurate, this means that it can easily discriminate between the two sets of data.
We can conclude that a drift has occurred, and that the model needs to be recalibrated.
On the other hand, if the accuracy of the model is around 0.5, this indicates that there has been no significant drift between the two datasets. The model can therefore continue to be used.
This method is effective, but requires the model to be trained and tested each time new data becomes available, which can be very costly.
Finally, a method based on time window distribution takes into account the timestamp and occurrence of events. The ADWIN (Adaptive Windowing) technique, for example, consists of starting to dynamically increase the W window as long as there is no apparent change in the context, and reducing it when a change is detected.
The ADWIN algorithm attempts to find two sub-windows with distinct averages, and abandons the oldest sub-window.
The main methods for calculating the difference between two populations are the Population Stability Index, the Kullback-Leibler Divergence, the Jensen-Shannon Divergence, the Kolmogorov-Smirnov Test and the Wasserstein Distance.
What is the Kolmogorov-Smirnov Test?
The Kolmogorov-Smirnov Test (KS Test) is a statistical test that requires no user input. It is used to compare continuous or discontinuous probability distributions.
It can be used to compare the distribution of a sample with the reference probability distribution, or two samples of population distributions with equal variability, to check whether they are drawn from different population distributions of unknown parameters.
This method takes its name from Andrey Kolmogorov and Nikolai Smirnov, who were the first to propose its use for very large arrays of random numbers generated by humans.
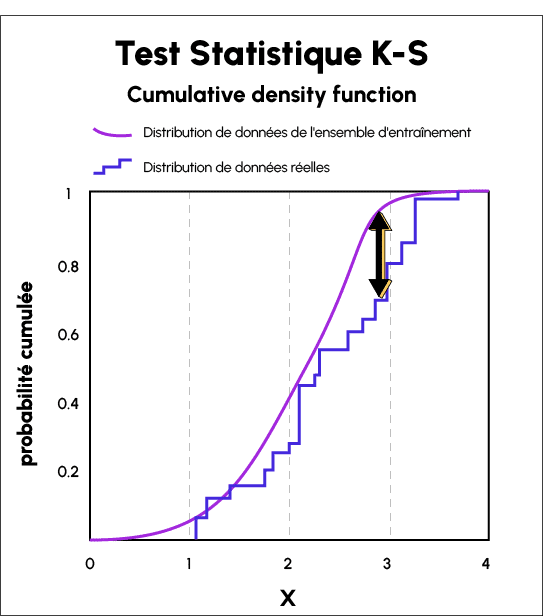
The Kolmogorov-Smirnov statistic is used to quantify the distance between the distribution functions of real-world sample data and the data distributions of the training set.
It yields a list of ‘p’ values for the training data and the real-world data, and the distance between the two curves reveals the data drift.
How do I solve a data drift problem?
Data drift can be detected quickly using the various methods described above. It is then important to take steps to resolve the problem.
However, there are several things to consider before taking action. First of all, check the data in the feedback loop.
It is essential not to inject deteriorated data into the pipeline.
If the quality of the data is correct, check the model’s performance for a specific business use case. If the model is still capable of generating reliable predictions, you might consider adding a percentage of the new data ingested via the feedback loop to the dataset and retraining the model.
This gives a better representation of reality, while maintaining the same degree of accuracy.
If the model no longer performs as expected, this means that the data used for training and validation were not representative of the reality of your use case. It is therefore necessary to rebuild a complete dataset with the new data ingested, or to wait until you have enough data to train the model again.
Data Drift vs Concept Drift: what's the difference?
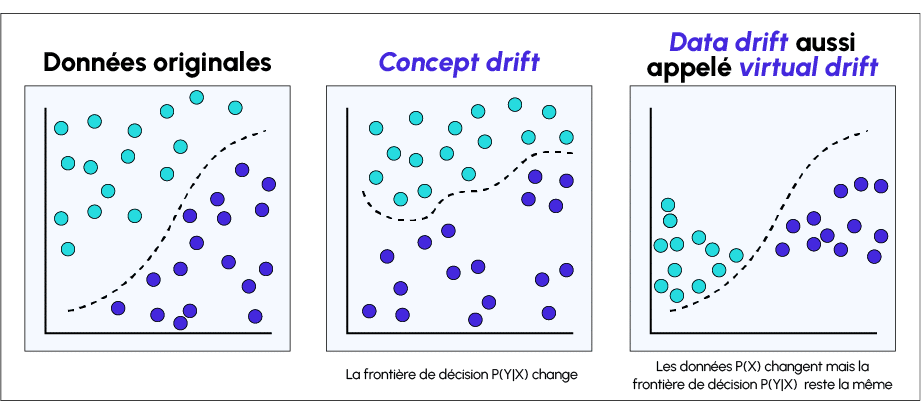
Data drift occurs when there is a mismatch between a model’s training data and real-world data. This change in the data degrades the model’s performance.
Concept drift occurs when the target of the model’s predictions or its statistical properties change over time. The model has learned a function mapping the target variable during training, but has forgotten them over time or is unable to use the patterns in a new environment.
For example, spam detection models may need to be adjusted if the definition of spam evolves. Concept Drift can occur seasonally (such as clothing fashions), suddenly (such as consumer behaviour after the Covid pandemic) or gradually.
Concept Drift can be measured by continuously monitoring training data and identifying changes within dataset relationships. Popular algorithms for detecting concept drift include ADWIN (ADaptive WINdowing) for streaming data, and the KS or chi-square test for batch data.
Conclusion
And there you have it, you now know where data drift comes from, its causes, its characteristics and the possible solutions to be tested to resolve it. Data drift and concept drift are among the most common problems encountered in training Machine Learning models.
To become an expert in this field, you can choose DataScientest.
Our various training courses enable you to master Data Science and Machine Learning. By choosing one of our programmes, you can acquire the skills required to work as a Data Analyst, Data Scientist, Data Engineer or Machine Learning Engineer.
At the end of the course, you’ll know everything there is to know about managing datasets and training Machine Learning models. You’ll be ready to apply your knowledge in the workplace, just like the 80% of our alumni who found a job immediately.
Our innovative Blended Learning approach combines online learning on a coached platform and group Masterclasses.
What’s more, you can choose between an intensive BootCamp or Continuing Education. All our courses are entirely distance learning.
Our state-recognised organisation is eligible for state funding. Don’t wait any longer, and discover DataScientest!


