
Altair is the brightest star in the Eagle constellation. But Altair is also a statistical visualization library that works with a visual grammar. Find out in this article how it's used and why it's so popular...
What is Altair?
Altaïr is an open-source library for declarative statistical visualization grammar, known as Vega-Altaïr. It simplifies the process of creating professional-looking charts, provides a natural syntax, and produces high-quality visualizations that outperform Seaborn or Matplotlib, even when dealing with datasets containing up to 100,000 points. Explore this powerful library and its full documentation to unlock its potential.
How do I install and use Altaïr?
- Install with pip install altair
- Import it to the notebook using altair as alt
How do you work with graphic grammar?
A graphical grammar is a syntax that creates a visualization without specification and applies it to particular data.
For example, we’re going to work on a dataset of baby names in the USA:
Here, alt is followed by the chart library, Chart, then by the declaration of the data used (DataFrame baby_names_final), the chart type, mark_chart, a simple bar chart, then by the declaration of the data, x being the names and y being the number of babies having been born with that name by selecting the year 1980.
The distribution of certain first names over the years :
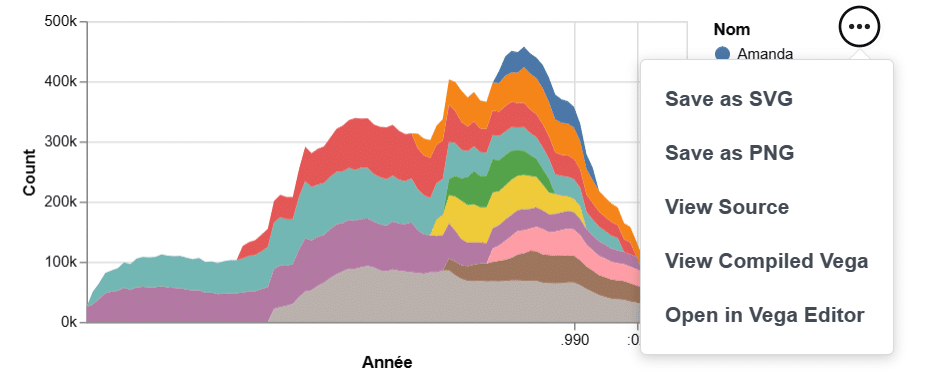
On the right-hand side of the graph, there’s a three-dot button that allows you to save the graph directly in various forms. View Source and View Compiled Vega allow you to read JSON files for the graph and open them with Vega Editor, which links to a github.io console as shown below:
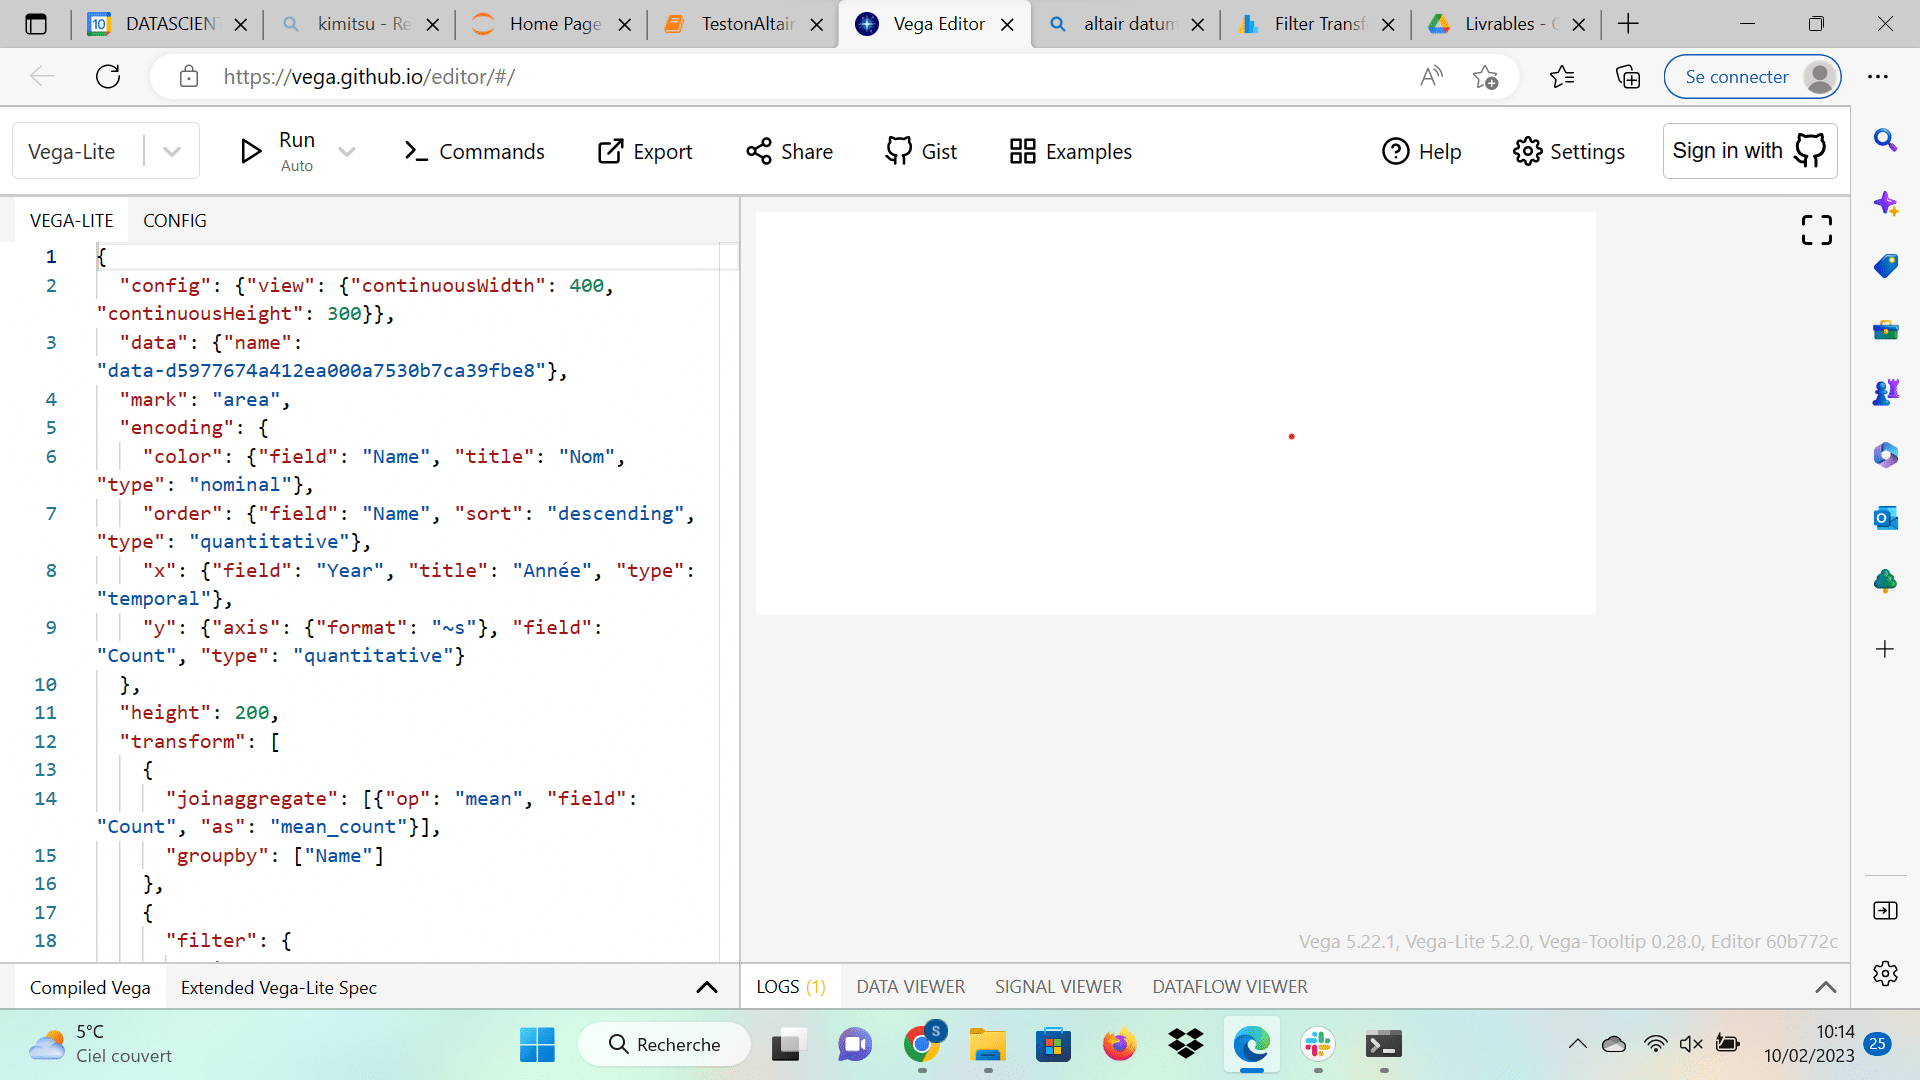
In Altair, data operations can be performed directly on the chart. You can use functions like `transform_joinaggregate` and `transform_filter` to perform operations similar to pandas’ groupby and filtering. Altair offers other functions as well:
– `transform_calculate()`: Used to calculate new values or metrics.
– `transform_density()`: Estimates a density distribution.
– `transform_window()`: Allows you to select a subset of the data.
– `mark_area()`: Represents a stacked area chart.
– `alt.FieldOneOfPredicate`: Specifies the choice of modes to use.
These functions provide powerful data manipulation capabilities when creating visualizations with Altair.
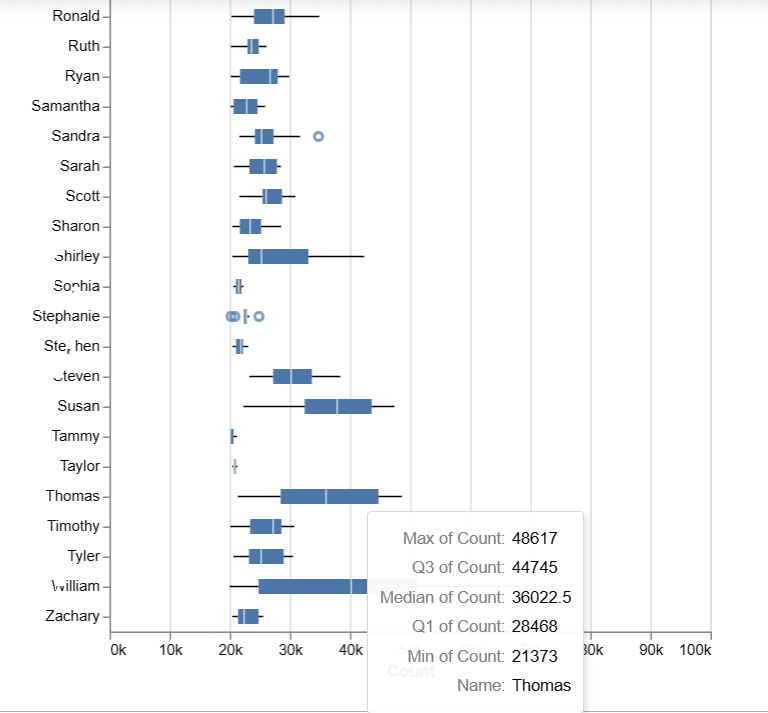
In the following example, you can create a boxplot that displays information when you hover over the boxes. This boxplot represents the distribution of the number of children with a specific name over the years (the Tooltip). When you hover over the boxplot, a dialog box opens with specific information about the name.
Other features include
Sliders can be added
Display can be modified at three levels: encoding (encode), mark (mark_ followed by a type) and full display .configure_()
The use of geographic coordinates in GeoJSON
Altaïr can also source its content from the Internet via URL links using alt.UrlData. Data must be in JSON and already processed. It is based on JavaScript libraries, d3j and Vega, which are often used for infographics in the Internet press.
Conclusion
Altaïr offers a declarative, easy-to-use alternative to matplotlib or seaborn, with an optimized graph framework and professional tools for visualizing statistical data, with better rendering and more intuitive grammar than traditional libraries. Visualizations are an essential element in information sharing for Data Analysts or Data Scientists within the company, during internal or customer presentations.
If you’d like to learn more about Data Science, click on the link to DataScientest, our training organization for the professions of tomorrow.


