
In graph theory, a decomposition tree is a decomposition of a graph into separators, connected in a tree. Proposed by Paul Seymour and Neil Robertson in their theory of graph minors, it is seen as a key concept offering a unique perspective for solving a variety of problems.
So what does tree decomposition or decomposition tree mean in data science? Find out in this article.
What is tree decomposition?
A tree decomposition of a graph consists in dividing the graph into substructures called “trees”. Each tree structure is associated with a set of vertices and represents a coherent region of the graph. Trees are then linked by specific relationships, creating an overall tree structure of the graph.
To better understand tree decomposition, we also need to consider its components:
- Local trees: each local tree consists of a set of vertices and their adjacent edges. These trees represent coherent subgraphs of the global graph.
- Separators: Separators are the sets of vertices that separate different tree structures. They act as connecting points between local trees, helping to build the tree structure.
- Connecting edges: These edges link separators and local trees, creating the hierarchy of the tree decomposition.
Why use tree decomposition?
This method can be used to solve a combinatorial optimization problem where the graph is part of the data. The idea is to solve the initial problem on each of the subsets of the decomposition, then merge the results into the tree using dynamic programming methods.
It is then possible to apply tree decomposition in various digital domains:
- Algorithm optimization: this structure facilitates the design of algorithms for difficult problems such as graph traversal, pattern matching and NP-hard problem solving.
- Network analysis: in the analysis of social, biological or communication networks, tree decomposition enables the discovery of structured sub-groups and key interactions.
- Database design: tree decomposition can be used to optimize join and query operations in relational databases.
- Computational biology: in computational biology, it can help model relationships between genes, proteins and metabolic pathways.

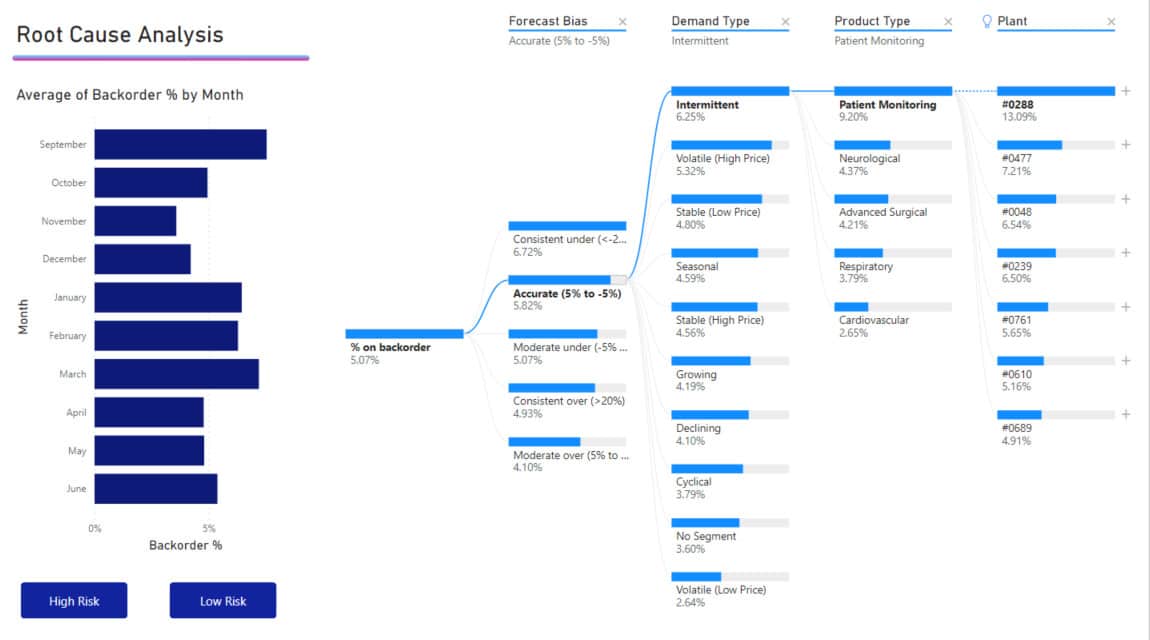
How do I create a tree structure on Power Bi?
Tree decomposition can be a powerful way of effectively analyzing and visualizing hierarchical data. This technique presents the relationships between different categories of data in the form of a tree structure. Here’s how to create a tree decomposition in Power BI:
Step 1: data preparation.
Organized data is essential for any data project. Make sure your data is organized and sorted into different categories, separating “parent” data from “child” data.
Step 2: Creating the hierarchy
Once you’ve organized your data, import it into Power Bi. Once imported, use the “Fields” pane on the right to select the table containing your data. Right-click on the “Parent Category” column and select “New Hierarchy”. Then drag the “Child Category” column into the new hierarchy. Don’t hesitate to rename this new hierarchy to make your work easier.
💡Related articles:
Step 3: using tree decomposition in visualizations
Now create a new page in Power BI by clicking on the “+ Page” icon at the bottom of the screen. Next, add a visualization, such as a table, bar chart or pie chart.
In the visualization, drag the created hierarchy into the appropriate zones. Place it in the Axes or Legends fields, depending on the type of visualization you’ve chosen.
When you display your visualization, you’ll see the different hierarchical categories. You can now explore the levels by clicking on the expansion arrows to see the sub-categories.
Step 4: Customization and formatting
Don’t forget to customize and format your visualization so that it’s aesthetically appealing and easy to understand. You can adjust colors, labels and titles to make your tree structure clearer.
Step 5: Sharing and publishing
Once you’re satisfied with your tree decomposition visualization, you can save your report in Power BI Desktop and publish it on the Power BI service for sharing with other users.
Tree decomposition is much more than just a theoretical concept in computer science. It represents a powerful strategy for tackling complex problems by breaking them down into more manageable structures
Its influence spans many fields, making it an invaluable tool for digital professionals and researchers alike.
Data science and its uses are transforming our daily lives and the way we work, and to stay competitive and efficient, training in these fields remains the best option. That’s why, if you’ve enjoyed this article and are considering a career in data science or Power Bi, don’t hesitate to discover our training courses on DataScientest.


