In the past, Microsoft Excel was the default solution for Business Intelligence and Data Visualization. However, since its introduction, Power BI has gradually replaced it. Companies use both Excel and Power BI, but what are the differences? What are their respective advantages and disadvantages?
What is Power BI?
Microsoft’s Power BI software is dedicated to self-service Business Intelligence. This platform makes it easy to create visually appealing reports from data. It can also be used to create interactive tables that can be easily shared.
There is a Desktop version of Power BI for local installation, and a Service version available via the cloud. The Power Query engine can be used to retrieve data from any source, thanks to a wide variety of connectors.
The DAX (Data Analysis Expressions) language enables queries to be programmed. Various tools and templates enable you to create reports and dashboards from data.
One of Power BI’s strengths is the creation of aesthetically pleasing reports and dashboards. In comparison, Microsoft Excel seems limited in terms of styles and options.
Thanks to the cloud, reports and dashboards can be shared very easily via the web. Teams can therefore collaborate on a project in an efficient and coordinated way. Visualizations can be opened on mobile platforms such as iOS and Android, or even on a connected watch.
Various security features help to protect data. Another advantage over Excel is that Power BI prevents obsolete data from being shared, so that everyone has access to the latest version of the report or dashboard.

What is Excel?
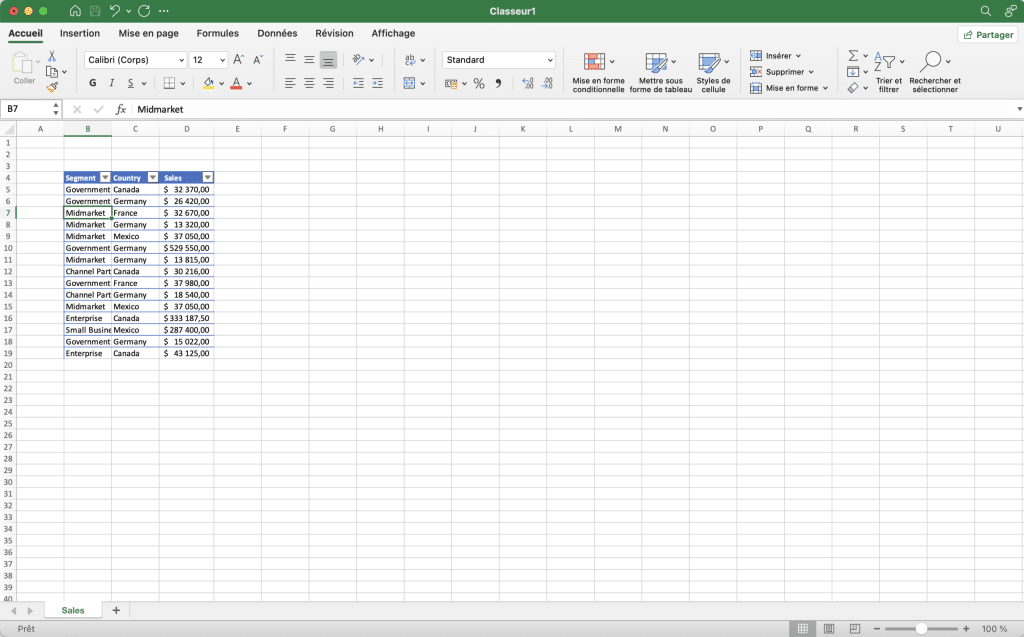
The Excel spreadsheet application is world-renowned and offers many possibilities, including the creation of interactive dashboards in the style of Power BI. This software is particularly useful for quick analyses and calculations.
Using the VBA (Visual Basic for Applications) language, you can automate many tasks. Several free templates are available for creating dashboards.
However, dashboards created with Excel are less visually pleasing and don’t offer as many data filtering features. The advantage of Excel is that it offers far more diverse possibilities than Power BI. In particular, it is better suited to financial modeling and prediction.
With Excel, there is a risk of sharing obsolete data. However, such an incident can be avoided with sharing platforms such as OneDrive, SharePoint or Microsoft Teams.
Keep in mind that Excel is a general-purpose tool. This spreadsheet can also be used for data visualization or data scraping.
Differences and similarities between Excel and Power BI
Excel and Power BI use Power Query and Power Pivot. Mastery of these components is therefore an asset for both programs.
In fact, the two platforms integrate very well, since they were both created by Microsoft. A data model created in Excel can very easily be published in Power BI without transition.
Similarly, Excel and Power BI integrate seamlessly with other Microsoft Office applications, such as Teams and the Power ecosystem. This saves time and automates processes.
There’s really no need to choose between Excel and Power BI, as they work very well together. Generally speaking, Excel is ideal for exploring data, while Power BI is better suited to presentation and sharing.

The advantage goes to Power BI for sharing and collaborating dashboards and reports. All it takes is a few clicks.
Similarly, Power BI’s ability to analyze large volumes of data makes it the best option for data visualization. Its customized dashboards offer a 360-degree view, and alerts can be set on Key Performance Indicators.
In terms of interactivity and functions, Microsoft Excel is more limited for dashboards. Its tabular data format helps to visualize data in different chart formats, but it is not an ideal tool for larger data sets.
Power BI’s many features for formatting, natural language queries, editing or filtering make reports easier to understand, visually appealing, and highly dynamic and interactive.
How do I learn to use Power BI?
Power BI is now the most popular Business Intelligence solution, and will soon be as ubiquitous in the company as Excel. As such, mastery of this software is a highly sought-after business skill.
To learn how to use it, choose DataScientest. Our intensive training program enables you to learn how to use Power BI in just three days. The program modules cover an introduction to Power BI, data transformation with Power Query, the DAX language, data visualization and workspace management.
On completion of this course, you will be able to take the PL-300 exam and become a Microsoft Data Analyst Associate. A mock exam is also included in the program to help you prepare.
If you’re living in France, this course is eligible for funding under the Compte Personnel de Formation scheme. Don’t wait any longer and discover Power BI training!
Now you know everything there is to know about Excel and Power BI. Find out more about Power BI and Business Intelligence.


