
Business Intelligence (BI) allows all the actors of a company to have a global vision of their activities to help them in their decision-making.
Thanks to Business Intelligence tools, it is possible to create analyses on historical, current, or even predictive data. With the use of Big Data and data science, BI can handle a very large volume of data, quickly and complexly. The decisions that result from data analysis can be both operational and strategic.
How Business Intelligence could be implemented ?
We will detail the four different steps essential to BI, what are they?
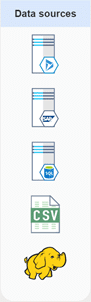
Data source
A company’s data is spread over several information systems, CRM (Customer Relationship Management), ERP (Enterprise Resource Planning), databases, flat files, etc. Thanks to BI, it is possible to extract and consolidate this data to render it through dashboards and allow users to perform detailed analyses. To deepen the analysis even further, it is possible to consolidate both internal and external data such as social networks or Gartner for example.
Although all this data is available and accessible, it must be retrieved, transformed, cleaned and arranged, and stored. And it is with the help of an ETL (we will see below how it works) that we can achieve this. All the data could be recovered and stored. Ideally, identifying the data that is essential to the expressed need will reduce costs and improve overall performance.
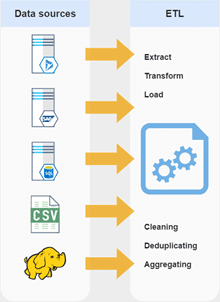
ETL (Extract Transform Load)
The objective of an ETL for Extract-Transform-Load is to recover data from different sources as input and to have clean data as output, exploitable by different analytical functions. For this, we distinguish three steps.
- Extraction: the data sources of a company are multiple, it is necessary for the ETL to have many connectors to recover the interesting data. The ETL will connect to the different sources to extract the data or, depending on the system, wait for the data to be sent.
- Transformation: this step is essential because it allows to clean, sort, organize the incoming data according to the needs. During the transformation, several rules apply such as standardization, deduplication or verification.
- Loading: the last step in the process, which consists of loading the extracted and transformed data into the data warehouse.
This entire process is generally automated. ETL takes into account exception handling.
This step in Business Intelligence is of paramount importance. The correct implementation of an ETL allows you to obtain qualitative, exploitable and analyzable data. With the reporting tools on the market, we will see that this step can be integrated directly into these tools. However, it is important to keep in mind that it is not optimal to work this way. For more robust and efficient processes, the use of an ETL is highly recommended.
Note: When very large volumes of data are processed using Big Data solutions, instead of an ETL, we use ELT (Extract – Load – Transform). In this case, all data is retrieved, stored without processing, usually in a data lake, and then transformed according to the needs.
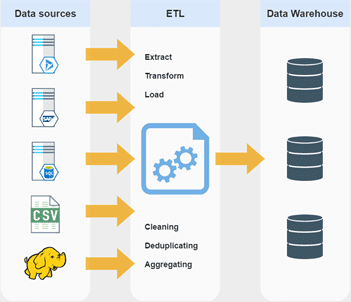
Data Warehouse
We have seen what data can be retrieved and how it is done. The next step is to store this data, generally using data warehouses. This is a set of databases that contains some or all of the functional data of a company. Thanks to the work done with ETL, the data is already well-structured and clean.
Data warehouses allow for the storage of important data, but not only. These warehouses are also used for data historicization. This way, no data is deleted or replaced, but historized over time. This makes it possible to build analyses with a follow-up over time of certain indicators. We have seen that the ETL performs a transformation of the data before loading them. It is also possible to store the raw data in addition to the transformed data. They can be used for future needs.
We will focus on the part that allows us to analyze the data. For this, there are good practices and rules to follow to have a coherent and efficient data structure in a BI context. The most common data model is the star schema. In this schema, we have 2 types of tables:
- Fact tables, contain measures such as KPI, price, and quantity;
- Dimension tables, contain business concepts such as customer, plant, and time.
Now we have retrieved the data from different sources, transformed it, and stored it in the Data Warehouse, which has been structured in such a way as to simplify the construction of our analyses. The last step was to create dashboards with the help of reporting tools.
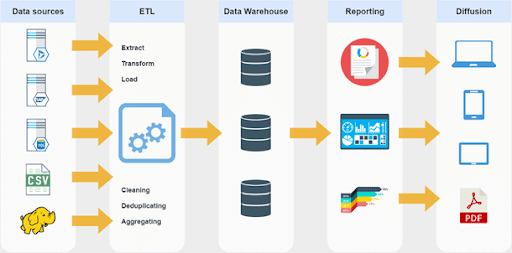
Reporting
The objective of these tools is to tell a story with the data we have retrieved. A grid with raw data is very often difficult to analyze and not efficient. This is why the use of graphs, depending on the type of data and the objective, is essential.
These tools are generally broken down into 4 parts:
- Retrieval of data stored in the data warehouse;
- Logical modeling of the data;
- Construction of dashboards;
- Sharing and distribution.
Uses of Business Intelligence
Many different industries have embraced BI earlier than usual, including healthcare, information technology, and education. All organizations can use data to transform their operations.
Financial services companies are already using BI to get a complete view of all their branches to measure performance and identify opportunities. Access to a central business intelligence platform has enabled some of them to bring all of their branch data together in a single dashboard.
Decision-makers at these companies can now identify customers whose investment needs might change. They can also see whether a region is performing above or below average and which branches are driving performance in that region. The result is more optimization opportunities and better service for customers.
The Future of Business Intelligence
The intelligence industry is constantly evolving in response to business needs and technology. It is also clear that artificial intelligence and machine learning will continue to grow and that companies can incorporate AI insights into their BI strategy. As they strive to become more Big Data oriented, there will be more data sharing and collaboration. Data visualization will be even more essential for working together in teams and across departments.
BI offers near real-time sales tracking capabilities and allows companies to discover insights into customer behavior, make revenue forecasts, etc. Various industries such as retail, insurance, and oil have adopted BI. More and more are joining every year. BI platforms are adapting to new technologies and user innovation.
We have seen all the key steps to build a successful process that respects the fundamental principles of Business Intelligence. From data sources to sharing and disseminating dashboards, we have covered the entire BI process.
BI is a cross-functional domain that links data to the business. By relying on numerous technologies related to Data Science, Data Engineering, and Data Analysis, it is possible to bring a lot of information to all the businesses of a company. If you want to know more about Business Intelligence, we have developed a Data Analyst training on this subject.


