
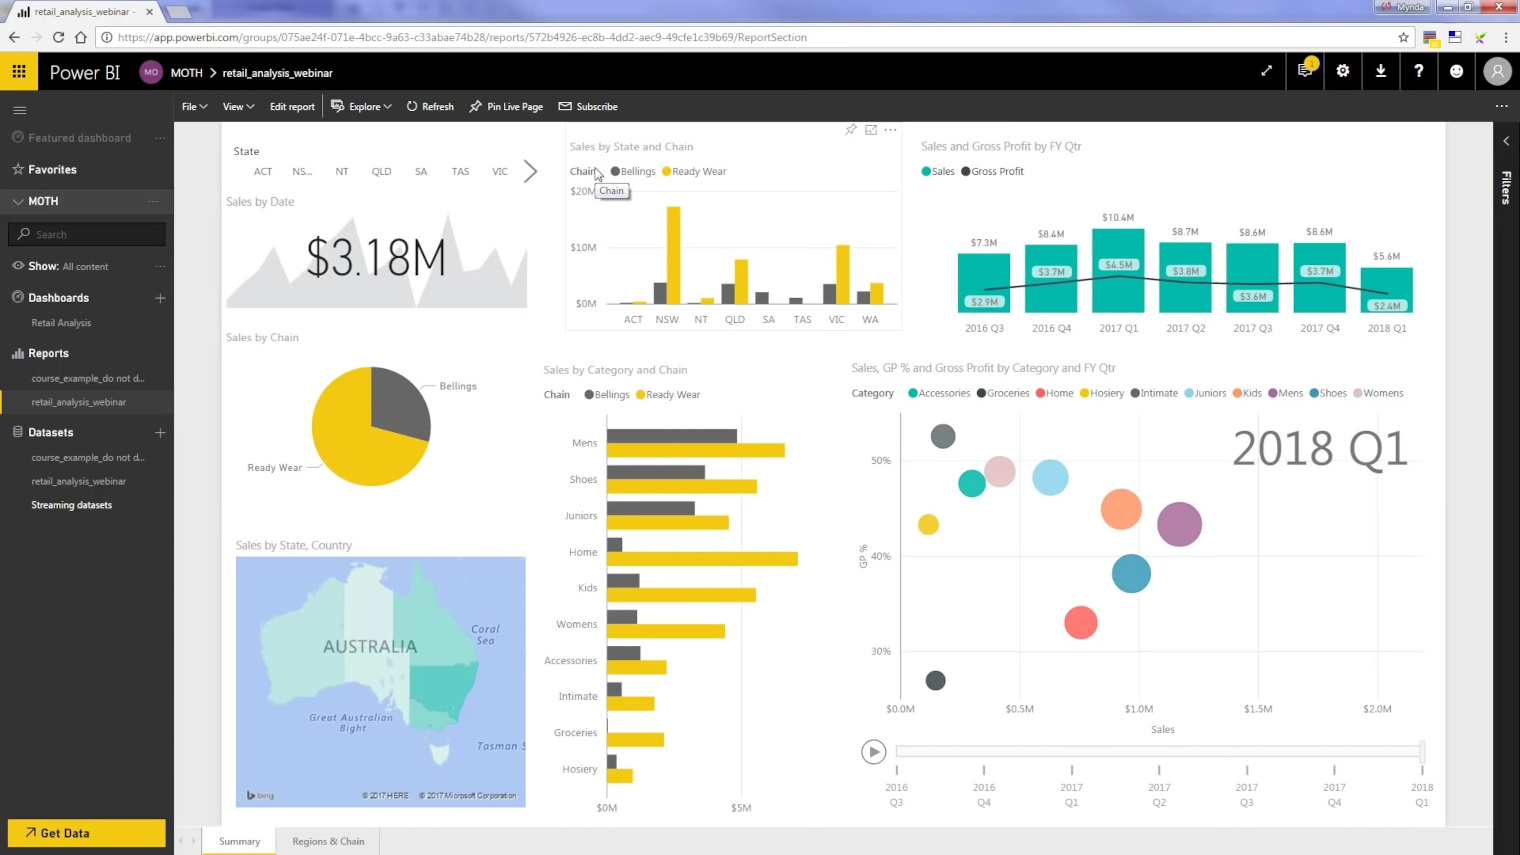
Among Microsoft products and services, Power BI is one of the most powerful tools for professional use. Here's how to create a dashboard. This means being able to read more easily an extract of the most important data from the report being produced.
What is the first step in creating a dashboard in Power BI?
Log in. Next, you need to access the panel section in the overview and select the panel option by pressing the “create” button just after it. It must be named and clicked for it to appear in the program’s sidebar.
💡Related articles:
How do I add information to a Power BI dashboard?
You need to enter the section where the reports are stored. Next, the visualisation must be pinned to one of the dashboards created. This is done using the pushpin icon that appears when you hover over the visualisations.
Is it possible to share a Power BI dashboard?
In fact, this is one of the main uses of the Power BI dashboard. The aim is to send a summary of the most important information in the Power BI report to the right person. This saves you having to read the whole document. By being able to freely choose its content, the process is simpler, allowing the user to transmit the information they prefer.
Can a dashboard be opened in Power BI from a report?
The answer is “yes”, but the process is different from that described above. For example, to get a report in Excel, you would need to :
- Download the file and save it in One Drive.
- Open the service in the browser using the address app.powerbi.com.
- Go to the navigation panel and select “my workspace”. Then click on “get data”.
- In the “files” section, click on “get”. Now it’s time to find the downloaded file, select it and click on “connect” and “import”.
- A window will open to indicate that everything is correct. Close it by clicking on the ‘X’ in the top right-hand corner.
The report will open in read mode. You will need to search in the control panel for “more options” and “edit”.
The mouse cursor can be placed over any element for editing. Before doing so, it is essential to use the side panel and select “new dashboard”. The process mentioned above is then repeated and the desired elements are selected with the pushpin icon.
The message “pinned to current panel” will appear on each item added. Click on “go to panel” and then on “save”. When you access the panel, you should see the docked items. To continue adding items, repeat the steps already explained.
Is it possible to add an entire page to a Power BI Dashboard?
Once you have accessed the report editor, select “Expenses overview”, which will open the second page. On the right-hand side of the menu bar, select “Pin to dashboard”. The icons in the panel will be updated at the same time as the page.
A window opens with the “pin to dashboard” option. The “existing panel” option must be selected. A window will confirm that the operation is correct. Now it’s time to click on “access dashboard” and check the icons pinned to the report.
What are the advantages of opening a dashboard in Power BI?
The first advantage is that you can organise the data to make it easier to interpret. You can also organise and centralise information more reliably. A company is constantly generating data that needs to be processed correctly. Power BI Dashboards make it much easier to analyse and monitor.
The idea is to have an overview of the different data generated by the company. Focusing on the data that is most important to the business means not wasting time examining other less critical or important data.
Each panel can be dedicated to measuring a specific set of data. Subsequent examination allows reliable conclusions to be drawn and possible future trends to be predicted. Staying one step ahead allows you to make sound decisions and avoid unpleasant consequences.
But if there’s one thing that Power BI dashboards are so famous for, it’s their ease of use. Anyone with no prior programming knowledge can create one and consult it. What might seem like an alternative has become an essential process that allows maximum customisation of the strategy to be developed.
There’s no doubt that this tool is now irreplaceable for companies that want to keep moving forward and not just look at their data in the usual way. A Power BI Dashboard can make all the difference, enabling any manager to run their business better than ever. Given its ease of use and multiple possibilities, recurring consultation is a sure-fire way to achieve the most positive results.


