The Jensen-Shannon divergence is used to measure the similarity between two probability distributions, particularly in the field of Machine Learning. Find out everything you need to know about this measure, from its history to its modern applications!
During the 20th century, the Danish mathematician Johan Jensen and the American statistician Peter Shannon made major contributions to information theory and statistics.
Born in 1859, Johan Jensen devoted much of his career to the study of convex functions and inequalities. In 1906 he published an article entitled “On convex functions and inequalities between mean values”.
In it, he introduced the notion of convexity, and established several results on Jensen’s inequalities that bear his name. These are mathematical results describing the properties of convex functions.
Peter Shannon was born in 1917 and for a long time studied measures of divergence between probability distributions. In particular, he worked on problems related to density estimation.
In the 1940s, several decades after Jensen’s work, the American developed methods for estimating the divergence between probability distributions.
It was based on the Kullback-Leibler divergence: a measure invented in the 1950s by Solomon Kulback and Richard Leibler, widely used to quantify the difference between two distributions.
It measures the dissimilarity between two probability distributions based on the logarithms of the probability ratios.
Later, in the 1990s, researchers began to explore possible extensions and variations of the Kullback-Leibler divergence.
Their aim was to take better account of symmetry and dissimilarity between distributions. They drew on the pioneering work of Johan Jensen and Peter Shannon to create the Jensen-Shannon divergence.
What is the Jensen-Shannon divergence?
Jensen-Shannon divergence was first introduced in an article by Barry E. S. Lindgren in 1991, entitled “Some Properties of Jensen-Shannon Divergence and Mutual Information”.
He developed this metric as a measure of symmetric divergence between two probability distributions. Its main difference from the Kullback-Leibler divergence on which it is based is its symmetry.
It takes the weighted average of two KL divergences. One is calculated from the first distribution and the other from the second.
The Jensen-Shannon divergence can therefore be defined as the weighted average of the Kullback-Leibler divergences between each distribution and an average distribution.
How do you calculate the Jensen-Shannon divergence?
The first step in calculating the Jensen-Shannon divergence is to pre-process the data to obtain the probability distributions P and Q.
The probability distributions can then be estimated from the data. For example, it is possible to count the occurrences of each element in the sample.
When the distributions are available, the divergence can be calculated using the formula :
JS(P || Q) = (KL(P || M) + KL(Q || M)) / 2
where M = (P + Q) / 2 and || represents the concatenation operator
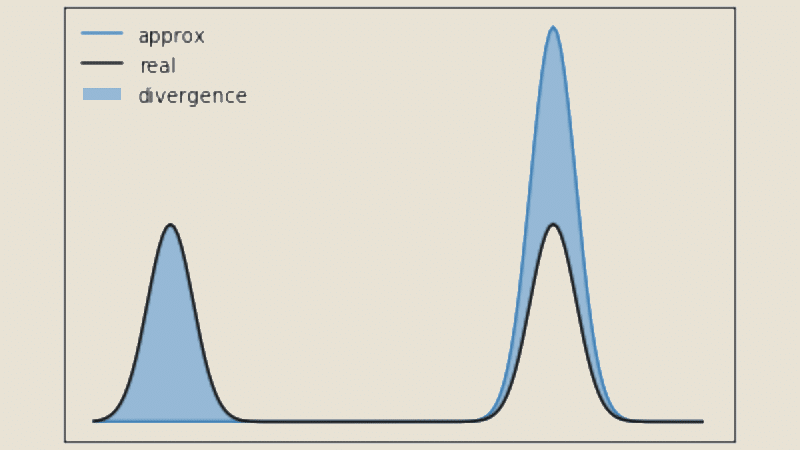
A higher value of JS divergence indicates greater dissimilarity between distributions, while a value closer to zero indicates greater similarity.
To illustrate with a concrete example, suppose we have two texts and we want to measure their similarity.
Each text can be represented by a distribution of words, where each word is an element of the alphabet.
By counting the occurrences of words in each text and normalising these occurrences by the frequency of the total words, we obtain the probability distributions P and Q.
We then use the Jensen-Shannon divergence formula to calculate a value that indicates how similar the two texts are!
There are several important properties of this measure. Firstly, it is always positive and reaches zero if and only if the distributions P and Q are identical.
In addition, it is upper bounded by log2(n), where n is the size of the alphabet of the distribution. It is statistically significant and can be used in hypothesis testing and confidence intervals.
Advantages and disadvantages
The strength of the Jensen-Shannon divergence is that it takes into account the overall structure of the distributions. It is therefore more resistant to local variations than other divergence measures.
It is relatively efficient to calculate, which also makes it applicable to large quantities of data. These are its main advantages.
On the other hand, it can be sensitive to sample size. Estimates of probability distributions can be unreliable when sample sizes are small, and this can affect the similarity measure.
It may also be less suitable when the distributions are very different. This is because it does not capture the fine details of local differences.
Jensen-Shannon divergence and Machine Learning
JS divergence plays a crucial role in Machine Learning. It measures the similarity between the probability distributions associated with different samples or clusters.
It can be used to group similar data together or to classify new samples by comparing them with reference distributions.
In natural language processing, it can be used to compare word distributions in different texts. This can be used to identify similar documents, detect duplicate content or find semantic relationships between texts.
It is also a tool for evaluating language models. In particular, it can be used to assess the diversity and quality of the texts generated.
By comparing the probability distributions of the generated texts with those of the reference texts, it is possible to measure the extent to which the generations are similar to or different from the reference corpus.
In cases where the training and test data come from different distributions, the Jensen-Shannon divergence can be used to guide domain adaptation strategies.
This can help to adjust a model trained on a source distribution to better fit new data from a target distribution.
Finally, for sentiment analysis, JS divergence can be used to compare profiles between different documents or sample classes.
This allows similarities and differences in expression to be identified, for example for opinion detection or emotion classification.

Jensen-Shannon divergence and Data Science
For data science, JS divergence is used to compare the similarity between distributions of variables or characteristics in a data set.
It can be used to measure the difference between observed data distributions and expected or reference distributions.
This allows variations and discrepancies between different distributions to be identified, which can be valuable for detecting anomalies or validating hypotheses.
For textual data analysis, this measure can be used to estimate the similarity between distributions of words, phrases or themes in documents.
This can help to group similar documents, extract common topics or detect significant differences between sets of documents.
For example, it can be used to classify documents based on their content or for sentiment analysis by comparing sentiment distributions between different texts.
When there is high dimensionality in the data, Jensen-Shannon divergence can be used to select the most discriminating features or to reduce the dimensionality of the data.
By calculating the divergence between the distributions of different characteristics, it is possible to identify those that contribute most to the differentiation between classes or groups of data.
Model evaluation: In the process of developing and evaluating predictive models, JS divergence can be used as a metric to compare the probability distributions of predictions and actual values.
This makes it possible to assess the quality of the model by measuring how closely the predictions match the actual observations. For example, it can be used to evaluate classification, regression or recommendation models.
Finally, it can be used to measure the similarity between observations or instances in a dataset.
By comparing the distributions of features between different instances, it is possible to determine the proximity or distance between them. This can be used in clustering tasks to group similar observations or to perform similarity searches in large databases.
Conclusion: Jensen-Shannon divergence, a key tool for data analysis and machine learning
Since its creation, the Jensen-Shannon divergence has been widely used in many fields, including computer science, statistics, natural language processing, bioinformatics and machine learning.
It is still an essential tool for measuring similarity between probability distributions, and has opened up new perspectives in data analysis and statistical modelling.
Researchers around the world use it to solve classification and clustering problems. It is a key element in the toolbox of scientists and practitioners in many fields, starting with Data Science.
To learn how to master all the techniques of analysis and Machine Learning, you can choose DataScientest.
Our courses will give you all the skills you need to become a data engineer, analyst, data scientist, data product manager or ML engineer.
You’ll learn about the Python language and its libraries, DataViz tools, Business Intelligence solutions and databases.
All our courses are entirely distance learning, lead to professional certification and are eligible for funding options. Discover DataScientest!


