The quality of machine learning performance depends largely on the information available. That's why Data Scientists need to carefully study the datasets they use. To do this, they have a wide range of statistical tools at their disposal. One of these is kurtosis. So what is kurtosis? What's it used for? Find out the answers.
What is Kurtosis?
Coming from the ancient Greek name κύρτωσις (meaning curvature), Kurtosis is a statistical tool for measuring the sharpness and kurtosis of the distribution of a real random value.
Kurtosis corresponds to the probability and/or frequency of occurrence of outliers (i.e. values that are extremely high or extremely low in relation to the mean). On a curve, this represents the extremities on either side of a distribution.
Good to know: we also speak of acuity coefficient, flattening coefficient and degree of curvature.

What are the different types of Kurtosis?
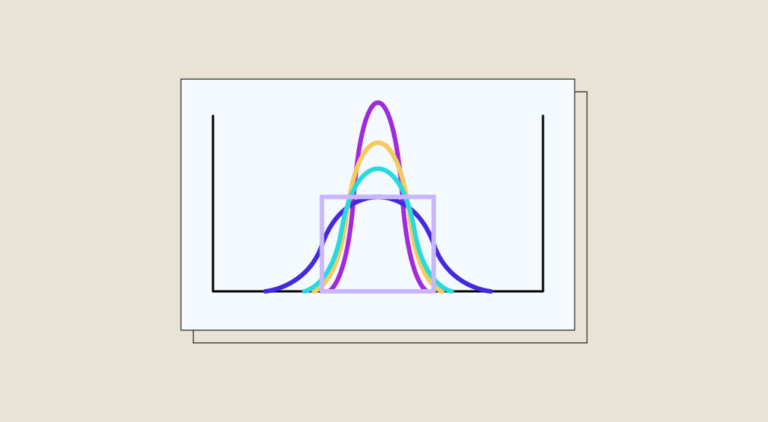
Depending on their degree of flattening, distributions can be classified into 3 categories.
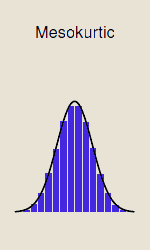
Mesokurtic distributions
These are distributions with average kurtosis. In other words, outliers are neither very frequent nor very rare.
Kurtosis is always measured in relation to normal Kurtosis. In principle, the normal distribution has a Kurtosis of 3. If this is the case, all distributions with a similar Kurtosis will be considered mesokurtic.
Good to know: Kurtosis is often described by an excess of Kurtosis, i.e. -3. This excess flattening makes it easier to compare distributions with the norm. But here, the excess of normal Kurtosis has a value equal to 0. And here again, all distributions with a Kurtosis close to 0 will be considered mesokurtic.
This type of distribution applies, for example, to the birth weight of babies. Even if there are outliers (5 or 2 kilograms at birth), they are neither very frequent nor very infrequent.
Platykurtic distributions
These are distributions with low kurtosis (fine tails). This means that outliers are very infrequent.
In this case, Kurtosis is lower than in a normal distribution. It is less than 3, and the excess Kurtosis less than 0. This is why we also speak of negative kurtosis, since the excess kurtosis is negative.
Good to know: the name PlatyKurtosis (and more precisely the term platy) comes from the Greek platús, meaning flat. This is because many platykurtic distributions have a flattened peak, although some may be pointed. But Kurtosis measures the length of the flattening (the two ends of the distribution), not the “peak”. PlatyKurtosis therefore comes from a confusion on the part of the statisticians of the time, but the term has stuck.
💡Related articles:
On a curve, a platykurtic distribution generally means a uniform distribution. There is almost no variation between the different variables.
This would be the case, for example, in a study of high school students’ use of social networks. Here, they are almost all the same age, and use almost all social media equally, whatever their age. There are few or no outliers (in a high school, few students would be over 18 or under 14).

Leptokurtic distributions
These are distributions with a high degree of kurtosis (also known as wide-tail distributions). In other words, there are many outliers. They are therefore higher than a normal distribution. This translates into a Kurtosis greater than 3 and an excess Kurtosis greater than 0. Here, we speak of positive Kurtosis.
A leptokurtic distribution could, for example, concern the Earth’s distance from other stars in the universe. Some are relatively close (or at least accessible), while others are hundreds of light-years away.

What is Kurtosis used for?
By determining the disparity of values within a distribution, Kurtosis is one of the essential statistical tools. It can be applied to a wide variety of business sectors.
Here are the most common:
- Financial analysis: Kurtosis is used to measure the risk of price volatility of an investment. If Kurtosis is high (in the case of a leptokurtic distribution), this means that the chosen investment will occasionally produce extreme returns. This can lead to exponential gains, but also to significant losses. Conversely, an equity portfolio with a low Kurtosis value indicates a more stable and predictable return. This means less risk, but also less profit.
- Machine learning: the aim here is to measure the disparity of a data set. This does not mean, however, that the available data is bad. The idea is above all to enable data scientists to better understand the dataset in order to improve the performance of machine learning.
What are the differences between Skewness and Kurtosis?
To measure the disparity of a dataset, Data Scientists can use Kurtosis or Skewness. In the latter case, the focus is on measuring the spread of the distribution around the central value. Conversely, Kurtosis measures the frequency of outliers.
But in both cases, they are essential measurement tools for machine learning.
Want to find out more about Machine Learning?
Beyond statistical tools, Machine Learning requires a wide range of skills in predictive analysis, computer language, databases, etc. As such, training in data science is more than necessary. That’s why we created the Data Scientist training course. Find out more!


