Correlation is a statistical tool used in Machine Learning to identify dependencies between several variables.There are several types of correlation. Find out more about the The Pearson correlation and Spearman Correlation below.
For data analysis, a Data Scientist has several statistical tools at his disposal. One of these tools is correlation.Correlation is a particularly useful statistical measure, enabling the relationship between two variables to be studied by calculating a correlation coefficient.
Correlation corresponds to the strength (indicated by the absolute value of the coefficient) as well as the direction (indicated by the sign of the coefficient) of the relationship between these variables. The direction can be either positive (when x increases, y also increases) or negative (when x increases, y decreases or vice versa). There are several types of correlation. Among these correlations, there are two that are particularly widely used: The Pearson correlation and Spearman Correlation. These two types of correlation will be discussed in greater detail later in this article.
The Pearson correlation and Spearman Correlation - The Pearson correlation
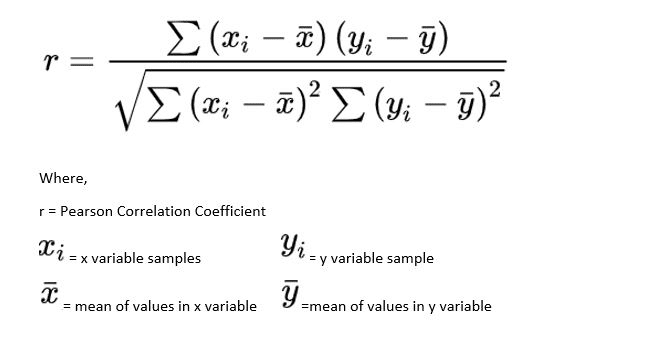
Pearson correlation, also known as linear correlation, measures the linear relationship between two continuous variables. Pearson correlation is indicated by the value of the correlation coefficient r, calculated using the following formula :
Before calculating the Pearson coefficient, make sure that the data meet the following assumptions:
- Data sample is random (representative of the population)
- Variables are quantitative (continuous)
- Data are paired (each x value is associated with a y value)
- Observations are independent
- Data are normally distributed
- Variables are linearly related
- No outliers in the data
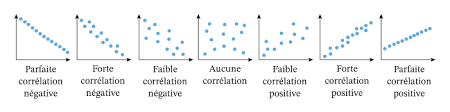
The value of the correlation coefficient r is between -1 and 1. There are several possible cases depending on the value of r :
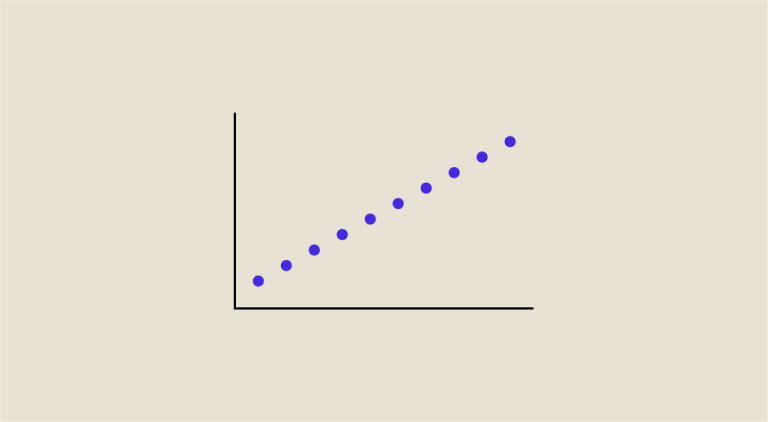
- If r is close to 1, then the variables are linearly positively dependent.
- If r is close to 0, then there is no linear relationship between the variables.
- If r is close to -1, then the variables are linearly negatively dependent.
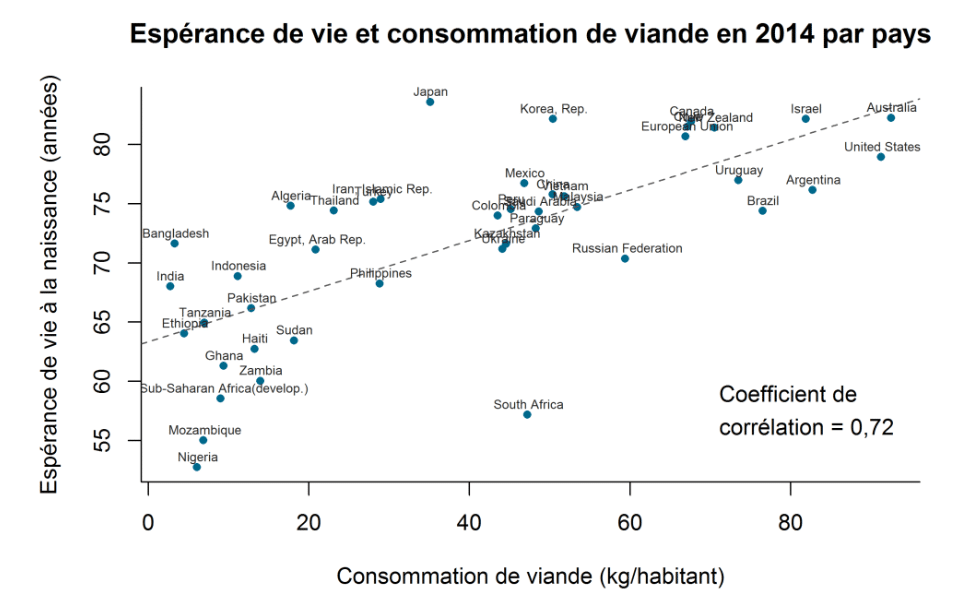
An example of the application of Pearson’s correlation would be the study of the relationship between meat consumption and life expectancy by country.
The Pearson correlation and Spearman Correlation - The Spearman's correlation
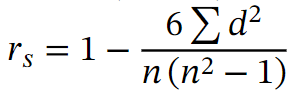
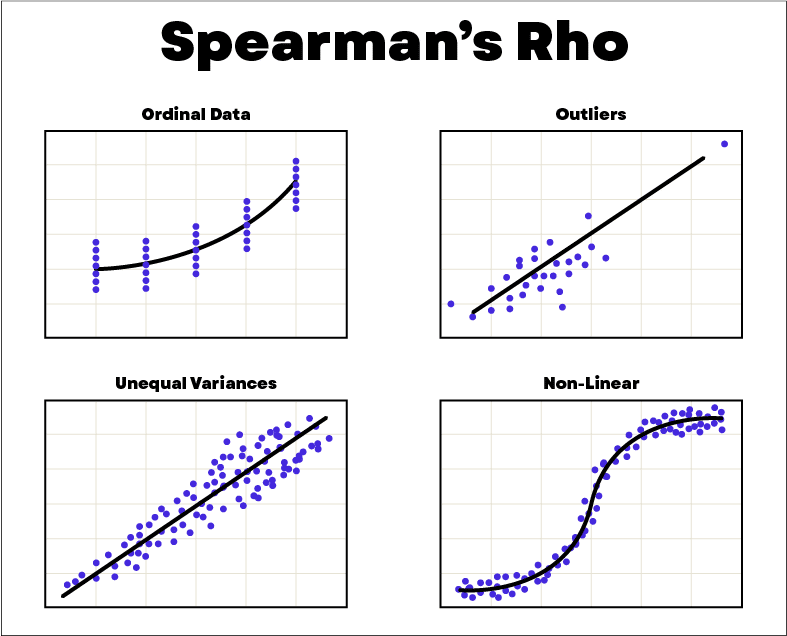
The Spearman correlation is a measure of correlation that measures a monotonic relationship between two variables based on the rank of the data. An example of data rank determination is: [58,70,40] becomes [2,1,3]. Spearman correlation is often used for data consisting of outliers. To measure Spearman correlation, the indicator used is the Spearman coefficient rs, also known as the rank coefficient, given by the formula below. In this formula, the variable n indicates the number of points in the data series. The variable d corresponds to the square of the difference in ranks between each point with coordinates (x,y).
Before calculating the Spearman coefficient, it is necessary to ensure that the data satisfy the following assumptions:
- The data sample is random
- The relationship between variables is monotonic
- Data are associated in pairs
- Observations are independent
- There is a monotonic relationship between the variables
- Variables are ordinal or continuous.
An example of the application of Spearman’s correlation would be the study of the relationship between consumer preferences and product price.
The Pearson correlation and Spearman Correlation - Conclusion
The Pearson correlation and Spearman Correlation are two different correlation measures that apply in specific situations. Spearman correlation uses data rank to measure monotonicity between ordinal or continuous variables. Pearson correlation, on the other hand, detects linear relationships between quantitative variables with data following a normal distribution. In the case of a Machine Learning problem, it is often a question of using correlation matrices made up of the correlation coefficients between all the variables in a dataset. The notion of correlation is therefore important for Machine Learning.
If you’d like to learn more about Machine Learning and go deeper into the field of data science, take a look at our Data Scientist and Data Analyst training courses.


