Despite the emergence of a wide range of data processing software, Excel is still one of the most widely used business solutions, for example to calculate means with Excel.
Through its functions and formulas, this Microsoft tool simplifies data preparation, analysis and visualization. One of the most important functions is, of course, Excel averaging. DataScientest explains how it’s done.
💡Related articles:
How do I calculate means with Excel?
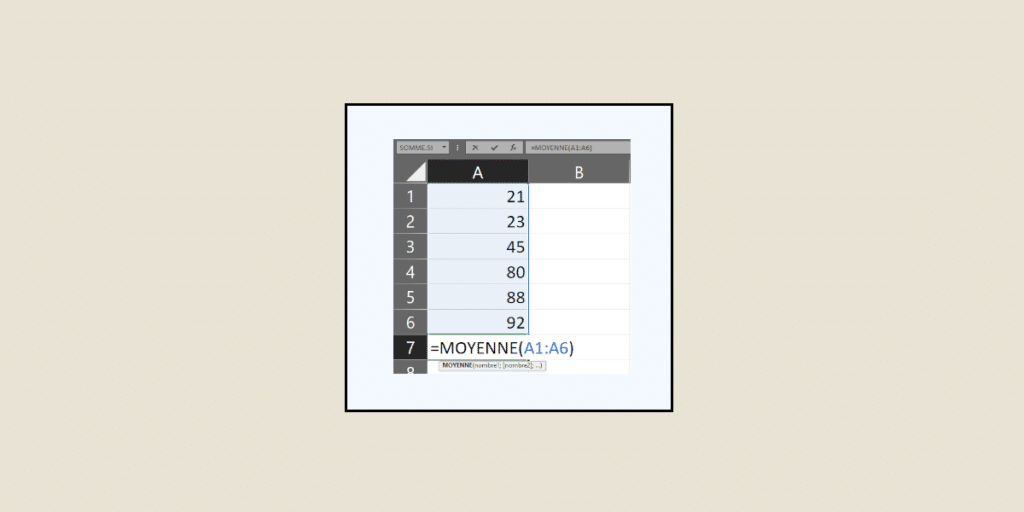
The average is the sum of all numerical values in a list, divided by the number of terms. To calculate it with a Microsoft 365 Excel spreadsheet, you don’t need to add all the values manually. Instead, you can use a specific function. Here’s how to do it:
- Select an empty cell in which you want the average to appear;
- Type =MOYENNE( ;
- Select the cell range for which you want to calculate the average;
- Close the parenthesis;
- Type Enter.
For example, the average calculation formula in Excel might look like this: =MOYENNE(A2;A23). The average then appears in the cell where you wrote down the formula.
Good to know: rather than typing formulas manually, you can also use the formula designer to avoid typing errors.
Here’s how: go to Formulas > Insert > choose your function. The formula designer appears for you to enter your data. But beware, depending on the version of Excel (Excel 2016, Excel 2019, Excel 2021, Excel for Mac, …), there may be slight variations in the approach.
How do you calculate the average of non-adjacent cells/ means with Excel?
While the previous method is very efficient for calcuating means with Excel it necessarily implies that cells are adjacent to each other within the same data range.
But what if you only want to include certain non-adjacent cells?
Simply follow these steps:
- Select the cell in which you want the average to appear;
- Type =MOYENNE( ;
- Select the cells you wish to include in the average and separate them with semicolons;
- Close the parenthesis;
- Type Enter.
=MOYENNE(A2;A7;A15;A18;A23)

How do you calculate a weighted average in your Excel file?
The weighted average corresponds to the average of several numerical values, each of which is assigned a coefficient.
For example: if you want to know the weighted average of orders placed for different products, you’ll need to divide the total cost of orders by the total number of units ordered.
To explain this approach, let’s assume that the price per unit corresponds to column B, and the number of units sold corresponds to column C.
In this case, you’ll need to use the SUMPROD function. Here’s how it works:
- Select the cell in which you want the average to appear;
- Type =SOMMEPROD( ;
- Select the range corresponding to prices per unit, then add a semicolon ;
- Select the range corresponding to the number of units and close the parenthesis ;
- Add the divide symbol (/)
- Type =SOMM( ;
- Select the range corresponding to the number of units and close the parenthesis;
- Type Enter.
=SOMMEPROD(B2:B17;C2:C17)/SOMME(C2:C17)
How do you calculate an average while ignoring specific values?
If you wish to exclude certain specific values (such as values equal to 0), you will need to use the AVERAGE.IF function. Here’s how it works:
- Select the cell in which you want the average to appear;
- Type =MOYENNE.SI(;
- Select the cell range for which you wish to calculate the average, then add a semicolon;
- Type ” <>0″;
- Close the parenthesis;
- Type Enter
=MOYENNE.SI(B2:B17; ” <>0 “)
Go deeper in Excel with DataScientest
While the average is one of the most important calculations to know, it’s far from the only one. Indeed, to carry out relevant analyses or create Machine Learning models, Data Analysts and Data Scientists need to master a multitude of mathematical and statistical concepts, such as variance, standard deviation, mode, median…
All these methods are reviewed within our training courses at DataScientest.
But it’s not just a matter of reviewing theoretical calculation methods. Instead, we give them practical application to help you improve your data preparation, analysis and modeling skills.


