Today, Twitter is used by hundreds of millions of people worldwide. More precisely, the current estimate stands at around 330 million monthly active users and 145 million daily active users on Twitter. Another interesting figure: 63% of Twitter users worldwide are between 35 and 65 years of age.
The aim of this article is to carry out an exploratory visual analysis of the tweets in our dataset. In a second phase, the aim will be to classify the sentiments of the tweets according to whether they are positive, neutral or negative, using various models available in Python. In other words, to bring together sentiment analysis and NLP.
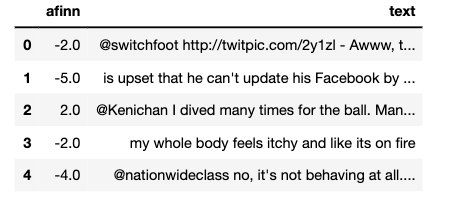
First, here’s a first look at the dataset we have available: download dataset, obtained using the df.head() command.
As we can see, this dataset, which lists a total of 1.6 million tweets, contains a column entitled label, which assigns a 1 if the sentiment of the tweet is positive and -1 otherwise.
As a first step, we’ll try to determine the month in which the twittosphere is most active.
A first trend emerges here:
May (5) and June (6) seem to be the months with the most tweets. There are a number of reasons for this, including the fact that Twitter is particularly aimed at young people, and that May and June are the end of their school or university year, giving them the opportunity to express themselves more on Twitter.
We also note that in June, the sentiment of tweets is rather negative (labelled -1), confirming the preconceived idea that Twitter can sometimes be a place where violence breaks out.
We could now ask ourselves which day of the week has the highest number of tweets:
Unsurprisingly, Twitterers use Twitter much more at weekends than on weekdays.
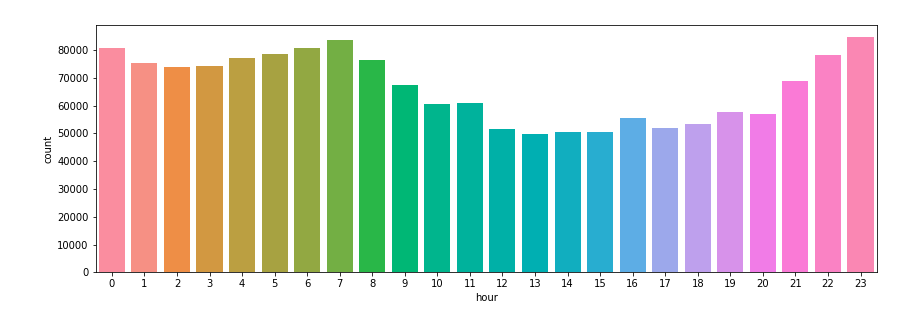
We can also take a look at the time of day when the most tweets are made, and also note without surprise that it’s especially before and after the start and end of the work/school day that the number of tweets explodes:
As usual, the idea is to divide our dataset into a training sample (80%), in which we’ll learn the model parameters, and a test sample (20%), in which we’ll test them.
However, as the explanatory variables are textual data (the tweets), we will first create new numerical explanatory variables linked to the tweets (metadata), so that we can then predict the labels.
METADATA CREATION AND CLASSIFICATION
To analyze the sentiment of a tweet, we can then extract what we feel is important such as:
The number of “http(s)” or “www.” links.
The number of e-mail addresses. (the number of e-mail addresses quoted in the tweet could have a bearing on the seriousness of the tweet).
Number of hashtags.
Number of user quotes.
Number of uppercase letters
The number of uppercase string letters.
The number of exclamation marks.
Number of exclamation point strings.
The number of question marks.
Number of question mark strings.
The number of periods ect (…).
Here is a new view of our dataset after metadata creation:
By grouping and summing each column of this new dataset according to the label
We notice that if the tweet is composed of links or e-mail addresses, it will tend to be much more positive.
With the explanatory variables now ready to be used, all we have to do is run our logistic regression model to classify the positive or negative sentiments of the tweets.
Here is the prediction score obtained by the model:
This gives a prediction score of around 60%, which is not extraordinary. To improve this score, we could use a bag-of-words representation of each word in the tweets, which simply represents the text as a vector that can be processed by a machine learning algorithm.
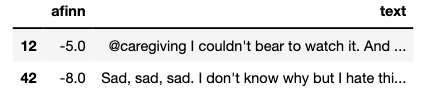
The AFINN lexicon is a list of English terms, the current version of which contains over 3,300 words, each associated with a sentiment score that we can obtain using the score method of the Afinn class.
The Afinn score is a categorical variable whose rule of interpretation is as follows:
Comme on peut le voir, Afinn est particulièrement performant et a permis de déterminer de manière catégorique le caractère négatif des 2 tweets ci-dessus.
CONCLUSION :
Through this article, we’ve once again seen the power of NLP to reliably classify the sentiment of tweets.
This Twitter sentiment analysis could have several areas of application, of which here are a few specific examples:
Social media monitoring: Detecting tweets with negative sentiment could help reduce the harassment and outpouring of violence occurring on Twitter.
Political campaigns: Sentiment analysis on Twitter could be used to analyze the popularity of a political candidate and thus predict the winner of a presidential election, for example.
Building customer loyalty: Sentiment analysis on Twitter can be used to track what is being said about a product or service sold by a company, and can thus help detect angry customers.
Did you like this article? Subscribe to our Newsletter to receive our previews!