“Data drives all we do”, le slogan de Cambridge Analytica se vérifie en permanence: les données influencent et structurent nos choix, en tant que consommateurs, citoyens, politiques, entrepreneurs…
This data provides a wealth of decision-making information. On a small scale, it’s relatively simple. But data experts need powerful tools to process and sort all this information on a macro scale (like the French population). Spectral clustering is just such a tool.
So, what exactly is spectral clustering, and how useful is it? What are the advantages and limitations of this model?
What is spectral clustering?
Definition
Spectral clustering is one of the components of machine learning and artificial intelligence.
It is a data partitioning algorithm based on spectral graph theory and linear algebra.
The idea is to segment a graph into several small groups with similar or nearby values.
The difference between clustering and classification
Classification involves grouping data according to a pre-defined class or group.
With clustering, on the other hand, the algorithm does not know the classes until it has grouped the data. This is referred to as an unsupervised learning technique.
The different types of data partitioning
There are several types of data partitioning, which differ in terms of their operation and purpose. Spectral clustering is one of them:
- K-means: the aim is to establish a reference average across a data set. The idea is to define a typical profile that can reach the greatest number of people. Spectral data partitioning, on the other hand, aims to create different groups with as many commonalities as possible.
- DBSCAN: this algorithm uses cluster distance and density to create sub-groups. Spectral clustering, on the other hand, is based on data similarity.
Why use spectral clustering?
Who uses spectral clustering?
Spectral clustering is particularly used by marketing professionals to understand user or target behavior.
But beware: this algorithm requires specific skills. As such, data analysts, data scientists and other data analysis experts are the ones who should be using it.
In what areas is spectral clustering used?
As spectral partitioning enables large-scale data processing, this method is often used for marketing purposes. Companies use this algorithm to segment their targets according to their expectations, needs, profile, maturity level and so on.
Spectral clustering can also be used in politics, particularly during election periods. By separating the mass of voters into smaller groups, candidates can communicate with each of them in a more personalized way.
How does the spectral clustering algorithm work?
The spectral clustering algorithm consists of several steps:
- Construction of a graph through the affinity matrix (or similarity matrix, adjacent matrix);
- Segmentation of data points into smaller dimensional spaces;
- use of eigenvalues and eigenvectors to define sub-graphs.
To help you better understand how it works, we explain the three essential concepts of spectral clustering.
Graphics
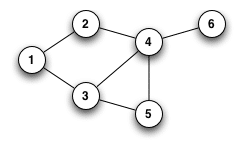
Graphs are a set of nodes linked by a set of edges. These nodes and edges may or may not be linked.
But in any case, graphs can be used to represent many types of data.
For spectral clustering, the starting point is a graph, either neighborhood, nearest neighbor (KNN) or fully connected.
This is then translated into matrix form. More precisely, the adjacent matrix.
Matrixes
The adjacent matrix (A) summarizes the relationships between all the data points in the graph.
For example:
Interacting data = 1
Data that do not interact = 0
The matrix can then look like the table below:
| 1 | 0 | 0 | 1 |
| 0 | 1 | 1 | 1 |
| 0 | 1 | 0 | 0 |
| 0 | 1 | 0 | 0 |
Next comes the degree matrix (D). Based on the A matrix, it calculates the sum of the links (horizontal and vertical). Based on the previous example, here’s the result:
| 0 | 0 | 0 | 2 |
| 0 | 3 | 0 | 0 |
| 0 | 0 | 1 | 0 |
| 1 | 0 | 0 | 0 |
Finally, the Laplacian matrix (L) corresponds to the degree matrix minus the adjacent matrix, i.e. L=D-A.
| -1 | 0 | 0 | -1 |
| 0 | 2 | -1 | -1 |
| 0 | -1 | 1 | 0 |
| 1 | -1 | 0 | 0 |
This matrix is then represented visually in the form of a graph, known as a Laplacian graph.
Vectors
Visual representation of the Laplacian graph (A) requires knowledge of the eigenvalues (eigenvalues= λ) and eigenvectors (eigenvectors=x).
Let Ax = λx
The eigenvalues and eigenvectors of a matrix can be found using numpy on Python.
Using these matrices and vectors, it is then possible to group several subgraphs together based on their similarities. One of the most common methods for Spectral Clustering will then be to apply a more classical Clustering algorithm such as the Kmeans method on the eigenvectors of this matrix
This method can be directly implemented using the Spectral Clustering module of the Sklearn library. The eigenvalues are used to determine the optimal number of clusters for partitioning your data.
💡Good to know: the number of sub-graphs (clusters) depends on the objective and the desired degree of targeting. From a macro point of view, it’s preferable to have a limited number of clusters for a better overall view. But from a micro point of view, it’s just as interesting to go into detail with as many sub-groups as possible.
Why use spectral partitioning?
The use of spectral partitioning is absolutely essential for understanding your target and addressing it in a personalized way.
Let’s take the example of people who subscribe to a clothing brand (this is the basis of our adjacent matrix).
Just because they all share the same affinity doesn’t mean they all have the same profile.
Subscribers include :
- Loyal customers ;
- Hesitant prospects;
- Stylists looking for inspiration;
- Marketing professionals monitoring the market;
etc.
Spectral clustering then segments the data into smaller sub-groups.
For companies, knowing each sub-group enables them to adapt their communication and offer. It’s all about addressing the right people, at the right time and in the right way, to multiply your chances of converting.
And, as we saw earlier, politicians can also use this algorithm to convince their voters.
What are the advantages and disadvantages of spectral clustering?
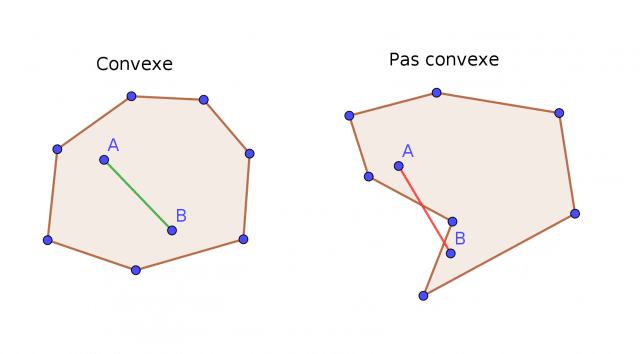
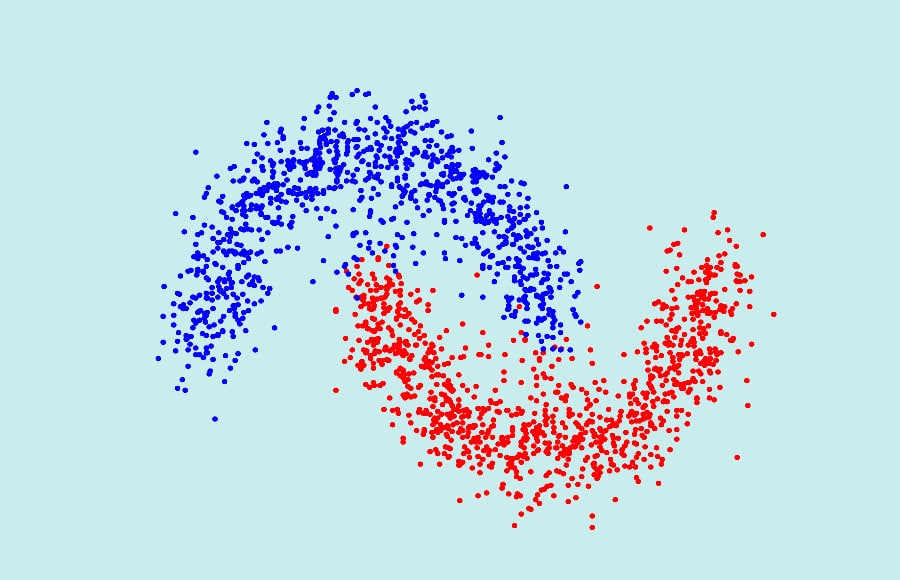
The undeniable advantage of spectral clustering is its ability to classify a set of non-convex data.
However, it’s a complex concept that requires not only a good understanding of how it works, but also, and above all, a mastery of linear algebra and spectral graph theory.
That said, the Python-based numpy tool does the calculations, simplifying the analyst’s work.https://datascientest.com/en/python-all-you-need-to-know
How do I learn about spectral clustering?
Since spectral clustering is particularly complex, it’s essential to get the right training to understand how it works.
An excellent training course in data science will enable you to master the tools needed to implement this algorithm.
You’ll then be able to use these skills in companies or public institutions to help them improve their communication, offerings and performance.


