
Data Science
IPython: Discover the Python shell at the heart of Jupyter Notebook
IPython is an enhanced version of the standard Python shell, offering many additional features. Find out more about its history, its benefits and its close
IPython is an enhanced version of the standard Python shell, offering many additional features. Find out more about its history, its benefits and its close

Power BI Python: Python can be integrated with Power BI to leverage the Data Science capabilities of Microsoft’s Business Intelligence platform. Find out how to

To maintain its position as the preceptor of language models, Open AI is developing new features for its API. These include the addition of the

Data Science is shaking up the world of finance. Find out how data science is being used by this sector, and how to become a

Large data sets can be easily analyzed and organized using Microsoft Excel. But it is very useful to know How to freeze rows in Excel…
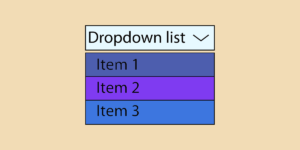
An essential function in Excel, the Dropdown Excel list facilitates data entry on spreadsheets, minimizing errors. But how do you create a drop-down list in

The Excel If function returns different results, depending on whether a test criterion is true or false. Find out all you need to know about

In this article, you’ll discover a dozen native Python functions (buit-in) that are sure to come in very handy! Just starting out in Python programming?

Table of Contents: Episode 1 Introduction Variables Types Episode 2 –Operators– Loops– Functions Episode 3 – Data Import – Data Cleaning – Data Processing Episode

Making games is one of the popular applications of artificial intelligence methods. 2019 saw the birth of one of the most interesting games to use

An SQL Join makes relational database management easy, thanks to joins that link two or more tables by means of common columns. The LEFT JOIN
How do you choose between two database systems as popular as PostgreSQL vs MySQL, each of which boasts unrivalled credentials in addition to recognized qualities:
