It’s good to know that Plotly, before being a well-known Python library, is a Montreal-based company founded by four people. Its aim is to develop visualization and data analysis tools. In this article, we’ll take a closer look at the plotly Python library.
What other tools does Plotly offer?
The company’s products are diverse and varied.
One of them is the Dash Python framework for developing web applications. It offers web applications deployed through a web browser, enabling online data visualization to be shared. Chart studio is another example of a tool created by the company. It is a software infrastructure for storing charts on a public or private interface. In public mode, pre-designed charts are made available to all users for download.
Among the various tools and libraries that Plotly provides in the field of statistics and data analysis, we will, in the remainder of this article, take a look at the famous Plotly library.
What libraries does Plotly offer for data-visualization?
1. Comparison with matplotlib
Thanks to the development of various APIs, Plotly is a library available in several programming languages, including Python (plotly.py), Java (plotly.js), R, Julia, Matlab and others. It can be used to create a wide variety of complex graphs. In the following, we’ll be looking at Plotly in Python, as it’s the most popular language in Machine Learning, as well as being one of the easiest to learn.
However, in this language, there is already a graphics library, much older than Plotly, called Matplotlib.
Matplotlib can also be used to create a variety of graphics with just a few lines of code, and appears to be fairly comprehensive.
The question is, how does Plotly differ from Matplotlib? What is Plotly’s added value?
The answer lies in the additional modes offered by Plotly.
Unlike Matplotlib, Plotly is a collaborative, interactive library. Thanks to Chart studio, it offers a web service and a collaborative mode which, as mentioned above, enables data graphs to be uploaded and saved to a personal account.
Interaction with the various Plotly servers enables the creation of this web service and collaborative mode. However, it is possible to activate a mode (by importing the offline package) which prevents the distribution of graphs on the cloud and makes them accessible only locally. In this way, the connection between the various Plotly servers is interrupted and the collaborative mode stopped.
Data visualization with Plotly is also more advanced than with Matplotlib. Over 40 different types of graph can be created, ranging from classic graphs to interactive, animated and 3D graphs.
In addition to its ease of use and ability to customize graphs, another major advantage of Plotly is its ability to detect outliers in even the largest databases. In fact, with Plotly, data information can be accessed simply by pointing the mouse over the graph. By reading the graph, outliers can be identified and recovered.
2. Plotly's sub-bookshops
In this section, we’ll introduce some of Plotly’s most important libraries, each of which provides additional tools.
- plotly.offline is a library that allows you to store graphs on your local computer and generate them offline by opening them in your web browser.
- plotly.plotly is a sub-library whose role is to establish the link between Plotly and your local machine. In other words, it’s an interface containing the functions to be executed in response to commands from the Plotly server.
- plotly.graph.objects provides objects for plotting graphs. It allows you to customize your graphs.
- plotly.express displays our graphs immediately.
- plotly.tools provides various additional tools. For example, it can be used to create subplots, i.e. a set of sub-graphs.
3. Demonstrating how Plotly works
In order to better understand how Plotly works, we’ll now try to visualize data through a concrete example. For this step, we have a database in the form of a csv file, giving access to information from the year 2016 on the bike rental system in Chicago called Divvy.
Hist matplotlib vs plotly
Below are 2 simple histograms showing the different types of travel in Montreal.
The first is a graph from Matplotlib and the second a histogram from Plotly.
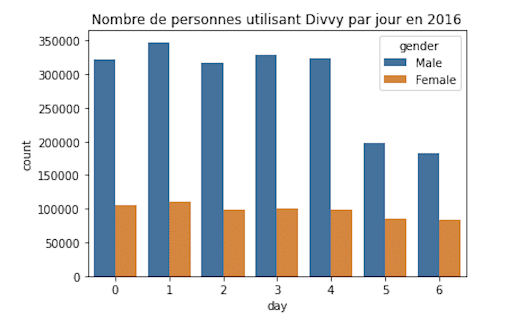
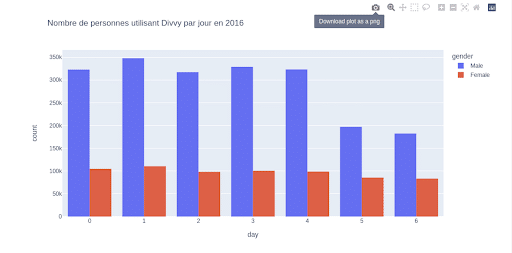
The graphs are quite similar. The major difference is the arrangement of several buttons visible at the top right of the graph created with Plotly. As an example, the first icon allows you to download the graph directly, resulting in an image of better quality than if it had been saved otherwise.
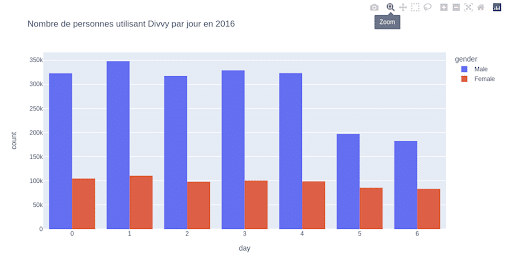
In the image above, the second icon shows a button available for zooming the histogram. The rest of the options are other functionalities for user interaction.
Maps with Plotly
With Plotly, you can create maps to visualize the mapping of the globe, a continent or even a city. Heatmaps, for example, are thermal figures that represent data in color according to frequency or position. The colors are displayed as a gradient on a frieze. For example, when creating a map showing the frequencies of our data, the more frequent a data value, the further its color on the frieze will move away from the rare value.
In our practical case, we’re going to use two straight lines drawn on a mapbox to display the two longest journeys made by bicycle. In other words, the routes where the point of departure and the point of arrival are the furthest apart in geographical terms.
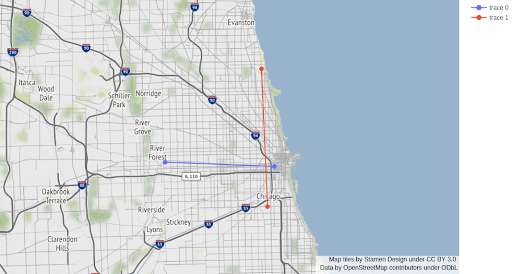
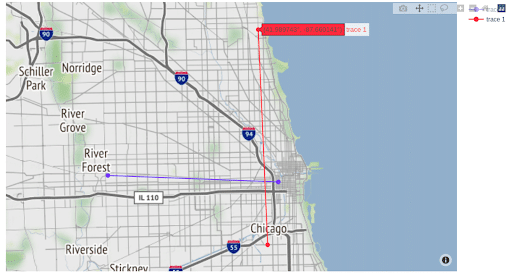
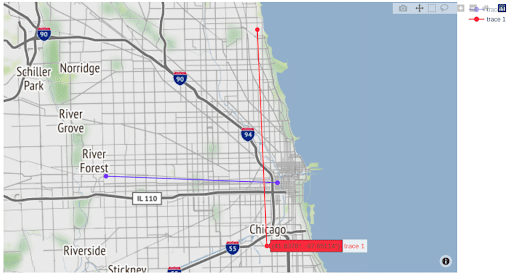
As mentioned above, by pointing the mouse at the data visible on the map, it is possible to obtain more information on the data in question. The two images below show the latitude and longitude of the two selected points.
3D graphs
3D graphics, which are easy to create with Plotly, can provide a wealth of information in a single graphical representation.
Below, we see the distribution of a sample of bicycle stations used by people in relation to their longitude and latitude. In the third dimension, the stations are distributed according to their monthly use. They are represented by dots of varying size, depending on the frequency of use.
In addition, a station is represented in red if it is most frequently used by men, and in blue if it is most frequently used by women.
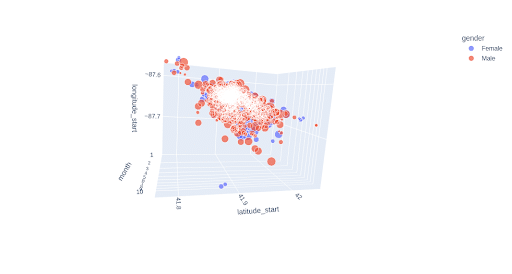
The 3D graphics are removable. They can be rotated and zoomed in all directions, for different views as required. Here are two examples.
Below, the axis representing the months of the year is highlighted.
Creating a drop-down menu with Plotly
It is possible to modify a graph using a drop-down menu, allowing you to specify what you want to observe. Using the widgets library, we were able to create the diagram below, displaying the duration of journeys made by users on different days and in different months.
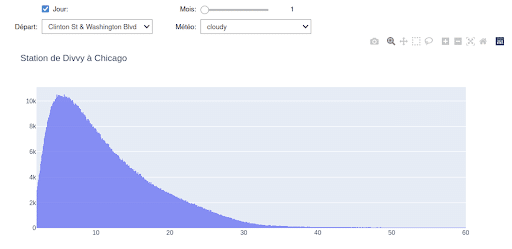
The menu allows you to select the starting station for the trips, the weather on the day the trips were made and the month in which they took place. The histogram can be divided into days, with or without a check mark.

Results after using Plotly
Plotly is, without a doubt, a crucial tool in the field of data visualization. It’s easy to learn and use, and allows you to create complex, elaborate graphs with the aim of representing data accurately and making it easy to understand.


