Business Intelligence (BI) enables us to understand the digital revolution impacting our economy and all organizations. In this article, we will strive to address the current challenges faced by the Finance function. Among these challenges, harnessing the available data proves to be strategic for enhancing performance management. While identifying the strengths of the market-leading BI tool, the primary objective here is to fully grasp the ongoing cultural shift.
As a reminder, the term “Business Intelligence” (or “informatique décisionnelle” in French) first appeared in 1958[1]. It can be defined as a “technological process of data analysis and information presentation to assist the company’s end-users in making informed decisions”[2].
1. The digital transformation of the finance function

The Covid-19 pandemic has profoundly disrupted internal practices within organizations.
While the percentage of employees partially working remotely had been steadily increasing between 2008 and 2017[3], the health crisis undeniably accelerated this phenomenon.
The organization of remote work proved to be crucial during the pandemic to ensure the continuity of activities, permanently propagating a hybrid work model[4].
The primary objective of certain management teams was to transform the crisis into an opportunity to gain agility and operational resilience. As early as April 2020, the French entity of the international KPMG network published[5] a set of key considerations, recommending, among other things, the “strengthening of administrative and financial functions” (page 9) through the development of “digitalized financial management.”
The underlying goals were to “respond promptly to business needs and transform data into information to enlighten strategic decision-making and operations.”
Implementing a BI culture within the finance function is, therefore, a means to address the challenges at hand.
2. Current challenges facing the finance function

The finance function must undergo a profound transformation to become the key partner within organizations.
According to PwC, 85% of surveyed financial executives believe that their role as a “Business Partner” was strengthened during the COVID-19 health crisis[6].
Among the strategies considered, better tools and more substantial dialogue with operational teams are highly favored.
This offers the finance function the opportunity to play a significant role in decision-making alongside top management.
Organizations are typically divided into departments (sales administration, procurement, etc.).
Often, each department has developed unilateral practices without emphasizing collective data management.
By embracing disruptive technologies like BI, financial professionals can centralize available data. Beyond its role in ensuring compliance with standards, the finance function gradually guides its internal clients towards more in-depth analysis.
Indeed, there is still room for improvement in data utilization. A study by the leading software provider, Sage, reveals that 64% of surveyed CFOs find decision-making based on data to be insufficient[7]. In these circumstances, the finance function will strive to manage the complexity of internal processes to fulfill its role as a Business Partner and practice data-driven management[8].
Through a 360-degree perspective, BI promotes the elimination of siloed operations and encourages the digital transformation of the organization.
3. Issues related to the digital environment

Today, the finance function operates in an undeniably digital context: virtual workspaces, process automation, utilization of internal and external data within the organization, and more.
Consequently, it is essential to grasp the emergence of new technological challenges.
The operational resilience of an organization encompasses all its components, including its employees, processes, and infrastructure. Within a digital environment, this resilience may face the cyber risk, which can manifest as the following realities:
| Risks | Definitions |
| Cybercrime | Exploitation or resale of obtained information |
| Destabilization | Damage to reputation through the exfiltration of personal data |
| Espionage | Access to strategic data of a country or organization |
| Sabotage | Partial or total paralysis of a country or organization |
Table 1: The main cyber risks for an organization
In this regard, the appropriate BI tool must also contribute to safeguarding the organization’s intangible assets. The geographical hosting of data, as well as their backup and replication, along with individually managed access, are all challenges to consider.
Another aspect of a digital resilience policy is that cloud computing also contributes to an organization’s technological competitiveness. Whether it’s public (accessible via the internet), enterprise (accessible via a private network), or hybrid (a combination of the two previous types), the cloud allows organizations to optimize their IT costs according to the chosen model: IaaS, PaaS, SaaS, etc. In the context of a BI project, the SaaS model is often preferred. This operational mode provides continuous and multi-device remote access while allowing roles to be distributed within the organization. Indeed, some team members, considered true “architects,” will be responsible for the development and maintenance of data visualization, while the majority of teams will focus on “self-BI” consumption of available content.
The challenges related to the digital context of the finance function are, therefore, manifold. It must choose a BI tool that not only ensures the protection of the organization’s intangible assets but also takes advantage of the benefits of operating in a SaaS mode. Ultimately, the goal is to deliver reliable information to the business and top management.
4. Use of available data

After primarily generating physical data in the past (e.g., books), human activity today produces a vast majority of digital data: the internet, social networks, video platforms, connected devices, and more. The “Big Data” phenomenon coincides with the exponential increase in available data, which can be of various types, including:
| Data Types | Definitions |
| Structured | These data involve letters and/or numbers. They currently represent approximately 20% of the overall volume (Schirmer, 2018). |
| Semi-structured | For example, this includes an email with content that does not follow a predefined structure but where the sender, recipient, and date are known (Schirmer, 2018). |
| Unstructured | Lacking a typical structure, these refer to the variety of data available on the internet, such as images, videos, audio, publications, etc. |
Table 2: Different types of digital data
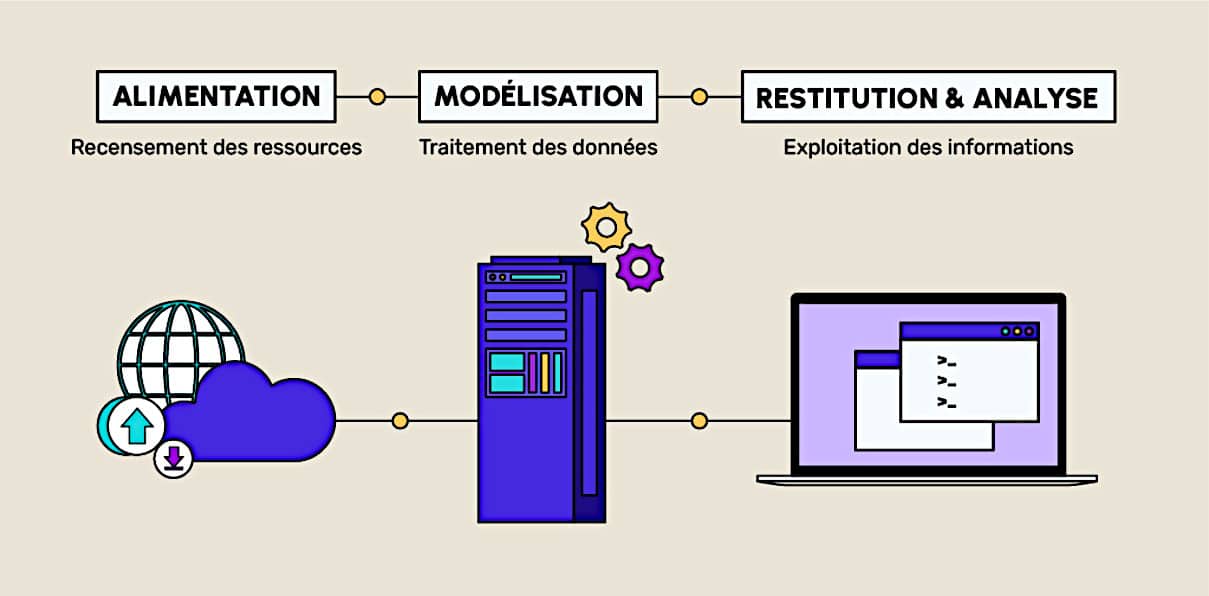
In theory, BI tools are primarily fueled by structured and semi-structured data generated by the Information Systems (IS). The IS is defined as an “organized set of resources (…) used to acquire, process, store, and communicate information” (Reix, 1983). The rapid and continuous evolution of digitization in recent years has made organizations of all sizes and sectors increasingly dependent on their IS. From this IS, BI enables the conversion of data (input) into information (output) through the following stages:
| Stages | Definitions |
| Data Ingestion | The first phase of the decision-making process involves collecting raw data through an "ETL" (Extract, Transform, Load) process to deal with the diversity of existing formats. |
| Modeling | The modeling phase involves structuring the centralized raw data within the Data Warehouse to make it available for reporting. |
| Reporting | During reporting, the processed data is distributed to various recipients in the form of reports, statistics, dashboards, etc. This phase is also known as DataViz (Data visualization). |
| Analysis | Finally, the analysis phase involves leveraging the provided information to draw conclusions. |
Table 3: The different stages of the decision information chain
These stages can then be planned by sprint using the following roadmap:

By drawing on data generated by the information system, BI enables the finance function to facilitate its decision-making process.
5. Business Intelligence for the finance function
“End-User Computing” (EUC) refers to two concepts: increased user autonomy and their non-professional status in the field of information technology.
The democratization of BI can be likened to the use of personal computers (PCs), which became widespread under the influence of American companies in the 1980s. During this era, the IT industry aimed to simplify users’ daily lives by providing machines with pre-integrated functions. The underlying concept of EUC emerged simultaneously, introducing the possibility for users to directly control their computing needs, including the ability to develop their own applications (Davis and Olson, 1985).
With the advent of so-called “low-code” tools, of which BI is a part, user autonomy has evolved towards application freedom, whether the user is an IT programming specialist or not. This type of tool, a true disruptive technology, was already worth more than 14 billion dollars in 2021 (Gartner, 2021), and its potential for further proliferation is substantial. In fact, nearly 80% of technology products and services will be built outside of IT teams by 2024 (Gartner, 2021).
Despite its more accessible technical dimension, BI represents a significant cultural shift. However, before considering changes in internal practices, it is crucial to identify the tools that best meet the organization’s needs.
6. The rise of Microsoft Power BI
As part of the Microsoft ecosystem, which is widely adopted in professional settings, the Power Platform was launched in May 2018[10].
Described as a “set of low-code tools”[11], this software suite includes a specific offering for Power BI. Power BI has been positioned as a “leader” in the BI platform category by the American consulting firm Gartner for several years.
Additionally, the Power Platform ecosystem primarily consists of Power Automate and Power Apps, both of which are also considered flagship products.
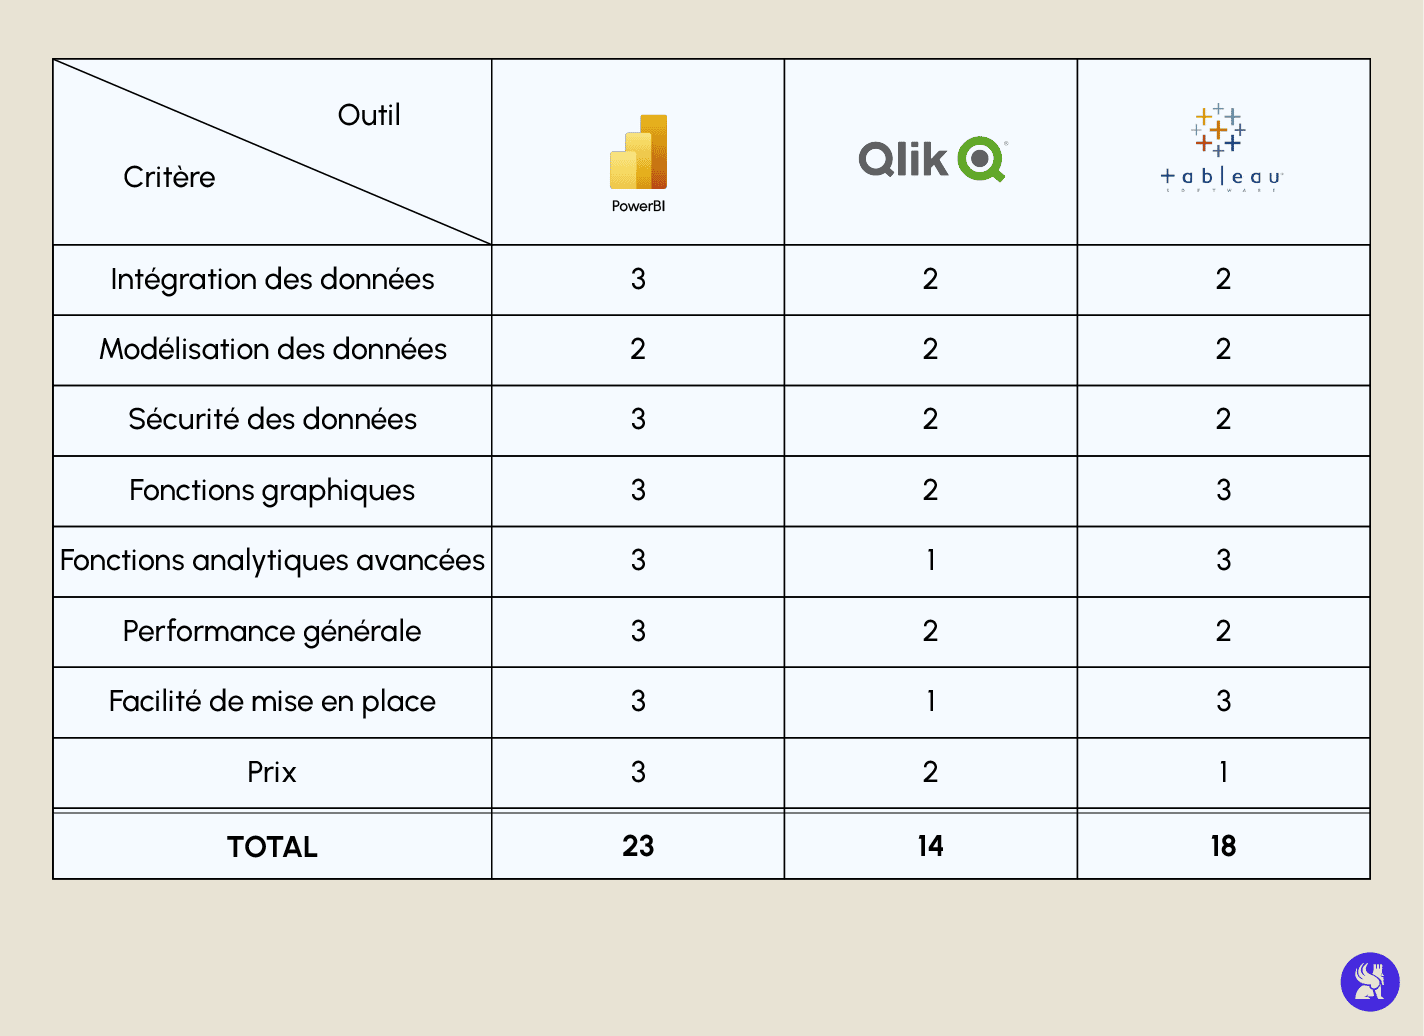
Therefore, the first step in raising awareness among teams is to select a supporting software. Here, we focus on the three leading products in the BI platform market: Microsoft Power BI, Tableau Software, and Qlik Sense. A comparison of their features is provided below. This comparison was compiled from various sources, including Gartner’s Magic Quadrant study and several specialized websites such as Lemagit, Sphereinc, Appvizer, Next Decision, and others.

Microsoft Power BI emerges as the most comprehensive application for the finance function, primarily due to its affordable price and its potential to make data analysis accessible to business users.
Despite its initially approachable technical nature, BI represents a deeper cultural change within organizations. To prevent resistance to change, the training of teams should not be underestimated. Guiding them towards new working methods is crucial, especially in terms of analyzing the available data. With this purpose in mind, a detailed presentation of the Power BI tool is available, along with specific training for a guided introduction to the tool.
7. Conclusion
In this article, we have presented the current context of the Finance function. To establish informed performance management, BI tools appear to be strategic in making organizations more data-driven. Furthermore, the widespread adoption of a hybrid approach between finance and data within internal teams could prove to be beneficial for the Finance function, which must embrace its role as a Business Partner alongside business units and top management.
Finally, in an upcoming article, various use cases will illustrate the diverse reality of the Finance function within organizations:
1. Corporate groups and the overall supervision of economic performance, along with standardizing accounting and financial practices.
2. Medium-sized enterprises (ETI) and small businesses (PME) and the analytical tracking of revenue stemming from sales management.
3. Start-ups and the implementation of a budgeting process, subsequently revised as needed through forecasts and reforecasts.
See you soon on the DataScientest blog!
Notes
- LUHN H. P., (1958), A Business Intelligence System, IBM Journal, Vol. 2, p. 314-319
- https://www.oracle.com/fr/database/business-intelligence-definition.html
- https://ec.europa.eu/eurostat/web/products-eurostat-news/-/DDN-20180620-1
- https://home.kpmg/ca/fr/home/insights/2021/10/beyond-hybrid-a-new-emerging-workforce.html
- KPMG, Dix points d’attention pour les comités d’audit pendant la crise du Covid-19, 2020, 12 pages.
- PwC, DFCG, Les priorités 2021 du Directeur Financier, Se réinventer durablement, 2020, 48 pages, p. 12.
- https://www.sage.com/en-gb/news/press-releases/2019/11/new-breed-of-cfo-has-emerged-says-sage-report
- https://www.lebigdata.fr/entreprise-data-driven
- https://powerplatform.microsoft.com/fr-fr/what-is-power-platform
- https://www.cnbc.com/2019/05/08/what-is-microsofts-power-platform.html
- https://powerplatform.microsoft.com/fr-fr/what-is-power-platform


