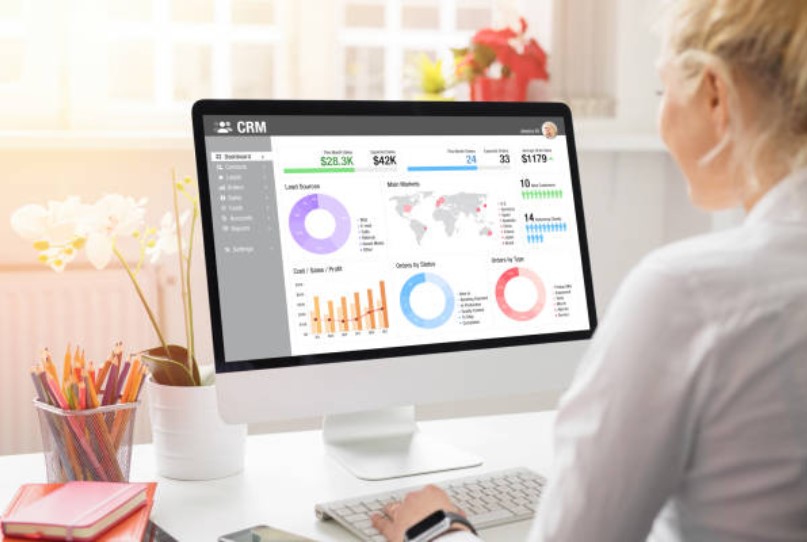
Whether it's to analyze the performance of a marketing campaign, track a company's financial results or monitor employee absence, it's essential to use measurement tools. Or more precisely, KPIs. The Power BI business intelligence solution helps you visualize and analyze your performance indicators. Find out all you need to know about Power BI KPIs.
What are the Power BI KPIs?
First of all, let’s look at the definition of a KPI.
Key Performance Indicators (KPIs) translate the effectiveness of actions taken to achieve a goal into measurable values. These values are known as KPIs.
There are several types. Here are the main ones:
- Quantitative KPIs: these are all actions that can be measured by a number (statistics, percentages, financial results, ….).
- Qualitative KPIs: these are actions that cannot be measured by numbers, such as customer feedback.
- Lagging KPIs: these use elements of the past to predict future events. Depending on a given event, these KPIs analyze the chances of success or the risks of failure.
- Anticipatory KPIs: here, current performance is used to predict long-term trends.
All the Power BI KPIs can be used in parallel to gain a clearer picture of the direction in which we’re heading.

Why use Power BI KPIs?
Power BI KPIs can be used in all areas of a company: finance, human resources, marketing, research and development, and so on.
They can be used to measure progress and adjust tactics, detect problems, monitor the organization’s financial health or motivate teams. Generally speaking, KPIs are a real decision-making tool.
To help you better understand the benefits of using Power BI KPIs, here are a few examples based on your objectives.
Example 1 - The marketing department wants to improve its visibility on search engines.
Here are some relevant KPIs:
Keyword performance;
Website traffic ;
Page positioning; …
Example 2 - Customer service wants to reduce attrition.
Here are some relevant KPIs:
Customer feedback;
Customer satisfaction score;
Dispute resolution time; …

Example 3 - The finance department wants to increase margins by cutting costs.
Here are some relevant KPIs:
Supplier expenses ;
Supplier delivery times;
Cost of raw materials; …
What are the advantages of Power BI performance indicators?
Today, implementing KPIs within a company is not only advantageous, it’s essential. It enables you to verify the coherence between vision and actions, streamline operational management, understand trends, position yourself against the competition, and so on.
Beyond KPIs, it’s also the use of Power BI that is advantageous. And with good reason: this tool enables you both to define key performance indicators and to design the dashboard. As soon as you modify the KPIs, the dashboard in turn evolves to meet the company’s needs as closely as possible.
How to create KPIs with Power BI
Defining objectives
Before creating KPIs with Power BI, you need to clarify your objectives. These may be strategic objectives for the entire organization, or for a specific department, in the short or long term.
Whatever they may be, these objectives must enable an operational action plan to be defined.
KPIs are then used to measure the effectiveness of actions taken.
💡Related articles:

KPI definition
To measure the effectiveness of the actions implemented, we advise you to select only those indicators that meet the specific objectives.
In fact, there’s no point in selecting too many indicators at the risk of losing sight of the objective.
What’s more, the KPIs selected must be able to show a trend. To this end, it’s a good idea to take stock of your current situation.
This will serve as a starting point for determining whether you’re heading in the right direction.
Finally, we recommend that you discuss the definition of the KPIs with all the employees involved.
KPI creation
To analyze the performance of an action, indicators are based on one or more data sources. You therefore need to ensure the relevance, reliability and quality of the database.
From there, the indicators must transform the data collected into performance measurements.
Dashboard creation
Key Performance Indicators (KPIs) are designed to help management make the best decisions. But KPIs need to be understandable.
For this, you need to use the Power BI data visualization tool. With it, you can create reports and send them to decision-makers. The latter can then quickly analyze company performance, trends or bottlenecks.
Based on the analyses, the manager will need to communicate with the employees responsible for achieving the objectives. This enables everyone to take stock of what has been achieved and what still needs to be done.
KPI tracking
As KPIs are evolving indicators, it’s vital to monitor them regularly.
To do this, you need to appoint a person to analyze the data and define a monitoring frequency.


