
Power BI is highly useful for comparing two time periods. Thanks to DAX functions and Quick Measures, you can easily compare data for the same period from one year to the next or from the beginning of the year to the current date. Discover everything you need to know about Time Intelligence functions for Power BI.
Within a business, it’s often crucial to compare multiple time periods. This allows for trend analysis or comparisons of sales and financial performance.
However, performing such calculations can be a real challenge when using Microsoft Excel formulas and tables. Fortunately, Microsoft’s Power BI business intelligence platform offers features that enable this type of comparison.
Time Intelligence functions assist Power BI users in performing calculations to evaluate business performance without the need to explicitly store them on a separate sheet for reference.
Time Intelligence calculations using DAX functions and Quick Measures are among the most commonly used features in Power BI, particularly for comparing the current period with the previous year.
What are Time Intelligence functions for?
Businesses often need to evaluate their performance over multiple time periods to compare trends. Decision-makers often want to compare Key Performance Indicators (KPIs) with their annual objectives.
For example, the objective may be to evaluate Year-to-Date (YTD) profits and adjust the strategy to address any gaps. Comparing the same period from one year to another can also help analyze performance trends.
Power BI functions provide an efficient way to implement these comparisons through simple calculations. This eliminates the need for complex Excel pivot tables.

Power BI: compare two periods with Quick Measures
Quick Measures in Power BI are an incredibly useful feature that allows you to perform common calculations quickly and easily.
Each Quick Measure consists of a set of DAX queries executed in the background, and the result is displayed directly on the report. This means you don’t need to write DAX queries yourself. Once created, the Quick Measure is automatically added to the table.
Several Quick Measures are available for common Time Intelligence calculations, such as “Year-to-date total,” “Quarter-to-date total,” “Month-to-date total,” year-over-year changes, or moving averages.
However, for Quick Measures to work, it’s essential to define a Date table beforehand. You can create this Date table using DAX, Power Query, or SQL.
Power BI: compare two periods with Quick Measures
In most cases, when connecting to relational data sources such as SQL Server, Oracle, or MySQL, the data model in the Data Warehouse often already contains a Date dimension.
You can simply import the existing Date dimension into the Power BI data model. This approach has the advantage of establishing a single trusted source for working with dates across the organization.
After connecting Power BI to a data source, you can select the Date table to have a Date dimension within the Power BI data model. This is the simplest and most common way to work with time in Power BI.
If you don’t have an existing Date dimension to import into your data model, you can easily create one using Power Query and its M language. Open a new Power BI file and choose the “Blank Query” option under the “Get Data” button. You can use parameters to create a flexible and customized Date dimension by selecting “New Parameter” in the “Manage Parameters” section. Define the start year and end year for your Date dimension.
You can find many ready-to-use M language scripts on the web to create your Date dimension and incorporate it into the data model. Simply copy and paste the script into the Advanced Editor.
Don’t forget to save the file in .pbit (Power BI Template File) format so you can change the time period for which to generate dates.
The third method for creating a Date dimension is to use the DAX language. The CALENDAR() and CALENDARAUTO() functions lay the foundation for all other required attributes such as weeks or business days.

Regardless of the method chosen to create a Date dimension, it is imperative to mark the table as a Date table. This is what allows you to fully leverage the Time Intelligence functions in DAX.
To be marked as a Date table, the table or column must meet several criteria. It must contain unique values in each row, contiguous values, and the data type must be Date. NULL values are not allowed.
To mark a Date dimension, right-click on it, hover your mouse over the “Mark as Date Table” option, and click on it. A dialog box will open, and Power BI will prompt you to select the column to apply the marking to.
The software automatically recognizes columns with the appropriate data type. As soon as you choose the column, Power BI performs validation. A small icon then appears next to the name of the Date column.
The Date dimension is created and incorporated into your data model. You can now manipulate and compare data for different time periods.
Compare two periods using DAX functions
To compare two periods in Power BI without using Quick Measures, the first step is to create a basic measure. For example, you can create a measure to calculate the total sales, and another measure to calculate the total sales for the previous month.
There are different calculation methods available. The DATEADD() function, widely used for working with dates in SQL, provides flexibility for shifted periods.
After creating these basic measures, you can visualize how the figures for two periods are correlated. To simplify the comparison, you can also use data visualizations such as line charts or card visuals.
It’s also possible to create additional measures to calculate the differences between the periods. Color-coding can be used to show positive changes in one color and negative changes in another.
The SAMEPERIODLASTYEAR() function allows you to compare data for the same period in the previous year. These various DAX functions make it easy to compare different periods.
Furthermore, the TOTALYTD function allows you to calculate Year-To-Date values easily. This helps evaluate performance from the beginning of the year up to the selected date, making it one of the most commonly used Key Performance Indicators (KPIs) by businesses.
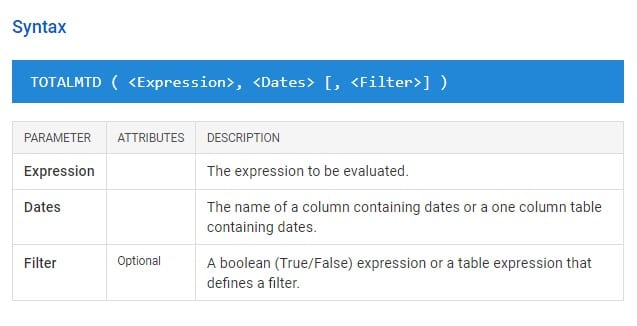
The TOTALMTD and TOTALQTD functions can also indicate Month-to-Date and Quarter-to-Date values to observe the evolution of metrics from the start of the month or quarter to the chosen date.
How do I learn to use Power BI?
Power BI is a highly valuable platform for Time Intelligence calculations. Comparing different periods is made easy, often without the need to write a single line of DAX code.
To learn how to navigate Power BI and its various features, you can choose DataScientest. Our training program allows you to master the software in just 38 hours spread over five days.
Beginners can opt for the three-day introductory course, while more experienced users can choose the two-day advanced track.
As a Microsoft Learning Partner, DataScientest prepares you for the PL-300 certification exam and provides the opportunity to take the test. Upon completion of the course, you will earn the official Microsoft Power BI Data Analyst Associate certification.
This training is entirely conducted online, and our state-recognized organization is eligible for funding through the Compte Personnel de Formation (CPF) for those in France or Bildugsgutschein in Germany. Job seekers may also be eligible for full coverage through Pôle Emploi or the Arbeitsamt. Don’t wait any longer; discover DataScientest today!
You now have all the information you need about comparing periods with Power BI. For more insights on the same topic, explore our comprehensive guide on Power BI or delve into our guide on the DAX language.


