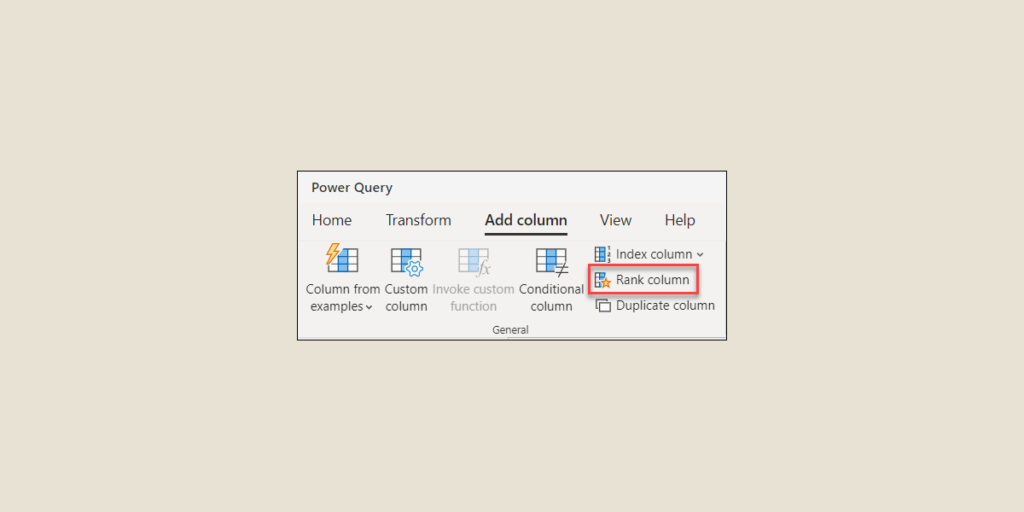
The Power Query Rank function ranks data by value. Find out all you need to know: how it works, use cases, customization options...
In order to analyze the data contained in a table, it is often necessary to identify the highest or lowest values in a column. In Microsoft Excel and Power BI, this is precisely what the Rank function in the Power Query data transformation tool can do. This “Rank” function simply ranks the values in a column according to their order of magnitude. Here’s how to use it!
What is the Power Query Rank function?
Rank is one of the many functions in Power Query for Excel and Power BI. It is widely used to rank values according to their relative position in a data set.
In addition to identifying extreme values within a column, it can be used to create groups of values according to their rank.
It is also possible to customize this Power Query Rank function to take into account additional criteria for ranking. We’ll come back to this later, but for now let’s take a look at how to use this function…
How do I use the Power Query Rank function?
To use the Power Query Rank function, follow these steps. Start by selecting the column containing the data to be sorted.
In the “Transform” menu, click on the “Rank” option. A dialog box appears, where you can choose from a range of customization options.
Simply click on “OK” to create a new column containing the rank values corresponding to the chosen criteria.
To illustrate this process in concrete terms, let’s take the example of a set of product sales data. To classify products according to their sales, we can use the Power Query Rank function to assign a rank to each one. This makes it easy to identify the best-selling products.
After loading this data into Power Query, simply select the “Sales” column. In the Rank dialog box, select the “Descending order” option to sort sales in this way.
The result: a brand-new column containing the rank values corresponding to each product according to its sales. The best-selling products have a lower rank, and are placed at the top of the list.
Alternatively, you can express the rank function in M language:
= Table.Rank(columnToRank, [Order=Order.Ascending], [RankType=Rank.Default])
The “columnToRank” argument is the column to be ranked and numbered, “Order” is optional and is used to specify the order in which the values are ranked, and “RankType” is used to specify the type of rank assigned to the values.

Power Query Rank function options
Before validating the creation of a rank column, you can select several options and ranking criteria. Here are a few examples.
Firstly, as mentioned in the example in the previous chapter, you can sort values in ascending or descending order. By default, they are sorted in ascending order, so the lowest values will have a lower rank.
To sort in descending order, simply tick the corresponding option in the dialog box. This can be useful for identifying the highest or most recent values within a column.
You can also choose break criteria to divide a column into rank groups according to certain conditions.
For example, a break criterion can be used to classify products according to their category or sales region. This allows you to identify the best-selling products in each category or region.
If you choose this option in the Rank dialog box, Power Query will create separate groups for each unique value in the break criteria column.
To use a break criteria in the Rank function, simply select the column containing the break criteria in the Rank function dialog box. Power Query will then create separate rank groups for each unique value in the break criteria column.
Finally, you can customize the range of rank values by specifying a start or end value. By default, the ranking starts with rank 1 for the smallest value.
This customization can be useful for creating a column of data whose rank values don’t start at 1. For example, this can be used to assign rank values according to percentage of total sales, starting with 0 for the lowest sales and increasing to 100 for the highest.
Conclusion: The Power Query Rank function is useful for classifying values
As you can see, the Power Query Rank function is particularly useful for classifying data by value or grouping them according to a specific criterion. In many situations, this saves valuable analysis time.
However, this is just one of Power Query’s many functions. To fully master this tool, you can choose DataScientest’s Power BI training.
In just 5 days, this comprehensive course will give you complete mastery of Power BI. You’ll discover Power Query and all its subtleties, the DAX language, and more advanced notions such as DataFlows and incremental updating.
At the end of the course, you’ll be able to use Power BI to create interactive dashboards and take the Microsoft PL-300 exam to obtain Power BI Data Analyst Associate certification!
All our training courses are delivered entirely by distance learning via the web, and our courses are eligible for funding options. Discover DataScientest!


