To better understand data, it's essential to analyze its relationships. And to facilitate this analysis when faced with tens of thousands of lines of data, there are mathematical formulas. In particular, the correlation coefficient.
What is the correlation coefficient?
Relationship and dependence between two variables
Before we can understand the correlation coefficient, we need to understand the relationships between the different variables in a dataset. Thus, if the values of a variable Y depend on the value x (or vice versa), there is a relationship between these two variables. Knowledge of X (or Y) should then make it possible to predict the other variable Y (or X).
For example, a company’s profit margin depends (in part) on the price of its products or services. There is therefore a correlation between these two values.
In mathematics, this relationship is expressed as follows: Y=f(X). Here, Y is considered the dependent variable, and X is the independent variable.
However, just because X allows us to deduce Y does not mean that the converse is true.
And to find out whether there is a correlation between two variables, you can use the correlation coefficient formula. But first, we need to define the form of a relationship.
The form of the relationship between two variables
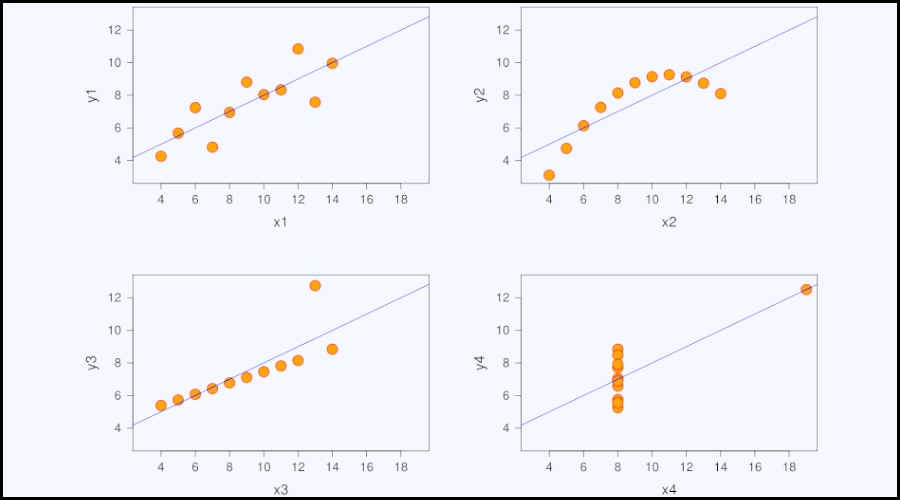
The simplest tool for establishing the form of the relationship between two variables is a graphical representation. Using a diagram, we can cross-reference the modalities of X and Y, with X on the x-axis and Y on the y-axis. This diagram can then be used to characterize the relationship between the variables according to 3 parameters:
- Intensity: the relationship between variables can be strong, weak or null. It is strong if the units have similar values for X and Y. Visually, this translates into a cloud of points with values close together.
- Conversely, if the values close to X are far from Y, the relationship is weak. And if they are very far apart (without any guideline), the relationship is zero. In other words, it’s not possible to predict Y from X.
- Shape: the relationship can be linear and monotonic (a straight line on the graph), non-linear and monotonic (a strictly increasing or decreasing curve) or non-linear and non-monotonic (the curve will be both increasing and decreasing, like a parabola or hyperbola).
- Meaning: this applies to monotonic relationships. The correlation is said to be positive when the two variables move in the same direction, or negative when they move in opposite directions.
Depending on the shape of the relationship, you’ll need to select the right tools. In particular, the correlation coefficient formula.
The correlation coefficient formula
The correlation coefficient is used to study monotonic relationships (whether linear or not). But depending on their linearity, two types of correlation coefficient are used (Pearson or Spearman), which we’ll look at in the next paragraph.
The formula used then differs according to the type of relationship. But it is always written in this form “r”.
The correlation coefficient can be used to link a multitude of variables. For example, the relationship between height and intelligence, price and margins, population size and pollution, caloric intake and disease, etc.
What are the different correlation coefficients?
Pearson correlation coefficient
The aim is to study linear and monotonic relationships.
The formula for Pearson’s correlation coefficient is as follows:
To calculate the Pearson correlation coefficient, start by calculating the covariance. In other words, the mean of the product of the deviations from the mean.
Then divide this covariance by the product of the standard deviations of X and Y.
Depending on the result, you can interpret the relationship between the two variables. For example:
- if r is close to 0: the linear relationship is zero. Note that just because there’s no linear relationship between two variables doesn’t mean there’s no relationship at all.
- if r is close to -1: there’s a strong linear relationship between the two variables, but
- it’s negative. They are therefore moving in opposite directions.
- if r is close to 1: there is a strong positive linear relationship between the two variables. They are moving in the same direction.
Good to know: while this correlation coefficient formula is effective for better understanding the relationship between two variables, it only works if the distribution is free of outliers. Otherwise, the results of the calculation may lead to totally erroneous conclusions.
Spearman's correlation coefficient
This formula (also known as the rank correlation coefficient) is used to analyze monotonic relationships. Regardless of the form of the relationship (linear, exponential, ….). As such, Spearman’s coefficient is best suited when there are outliers or skewed distributions. Through this calculation, the latter are less likely to distort the result.
What are the limits of the correlation coefficient?
The correlation coefficient formula is only the first step in determining the relationships between several variables. For a more comprehensive view, it is essential to carry out other mathematical calculations, such as significance testing and checking for the absence of bias.
Used together, these different statistical tools enable you to take a few extra steps in building a machine learning model.
But to better understand the connections between data and neural networks, it’s best to get fully trained in the science of data. Join our Datascientest training course.
Key points to remember
- The correlation coefficient indicates the relationship between several variables.
- It gives an indication of the intensity, form and direction of the relationship.
- Depending on the type of relationship, Spearman’s or Pearson’s correlation coefficients can be used.