The Drillthrough Power BI feature allow you to add a page dedicated to a specific entity within a report, in order to present it with in-depth data visualizations. Find out everything you need to know about this useful tool, and how to take a training course to master Power BI in its entirety.
Microsoft’s Power BI software is without doubt the most popular Business Intelligence tool in the enterprise. This platform enables you to analyze data from a multitude of sources, and create reports and dashboards, complete with visualizations.
One of Power BI’s strong points is the Drillthrough function, which enables you to create a page dedicated to a specific entity in a Power BI report. This entity can be a customer, a supplier or even a manufacturer.
This method is ideal for taking an in-depth look at a specific component, and aggregating actionable information.
💡Related articles:
What is Power BI?
Power BI is a Business Intelligence platform developed by Microsoft. It offers data analysis and visualization functionalities, through a very simple and intuitive interface.
This software suite makes it possible to collect data from a wide range of sources, present it in the form of visualizations and share it. A wide variety of graphs and charts can be used to visualize data and create interactive dashboards.
Many companies around the world use Power BI for its integration with Microsoft products and services. What’s more, this software enables real-time analysis of data streams for better decision-making.
The Power BI platform is available as PC software, a mobile application and as a Microsoft Azure cloud service. Data and tools can therefore be accessed from any device.

What is Power BI Drillthrough?
Power BI’s Drillthrough feature allows you to delve deeper into the details of a specific type of data or value displayed in a report.
It lets you explore the different layers of data in a dataset, and move from one report to another while continuing to analyze the same data set.
For example, a tabular report on sales data can be enhanced with a button allowing users to toggle between an analysis grid or a heat map to view the same dataset.
In this way, Power BI Drillthrough is essential for gaining a comprehensive understanding of data. It allows the same data to be analyzed with different visualization features and methods, rather than being limited to a single report.
How to use Power BI Drillthrough
To use Power BI Drillthrough, simply right-click on a data point on the report page you’re interested in. You can then “drill through” to the focused page to obtain the details you’re looking for.
However, it is first necessary to configure Power BI Drillthrough. This can be done on any report from Power BI Desktop or Service.
First, you need to define a “master report” for your target report from the reports tab. You can then build multiple Power BI Drillthrough reports.
To define the destination page, start by creating a report page containing the visuals for the entity concerned by the Drillthrough. For example, if the Power BI Drillthrough is for manufacturers, the page will contain visuals showing the total number of units shipped, total sales, sales by region or sales by category.
When the user performs a Power BI Drillthrough to this page, he or she will be able to observe these specific visuals. On the Drillthrough page, remember to add the field in the slot below the visualization panel.
Power BI automatically creates a back button visual that functions as a button in published Power BI reports. It allows users to return to the main report page.
This back button is present as an image, and can therefore be replaced by the visual of your choice. Simply go to the Home tab, click on “Image” and choose an image to place on the Drillthrough page.
Then go to “Format”, choose “Image” and activate the “Action” switch. Choose “Back” as action “Type”. The selected image is now used as a back button.
At any time, users can now right-click on a data point in the report to display a context menu with the Power BI Drillthrough for that page. This allows them to view information and visualizations on the selected data point.
Note that any filters applied can be transferred to the Power BI Drillthrough window. For example, if a user uses filters for only a certain product category in a report, they can retain this filtering when displaying the Drillthrough.
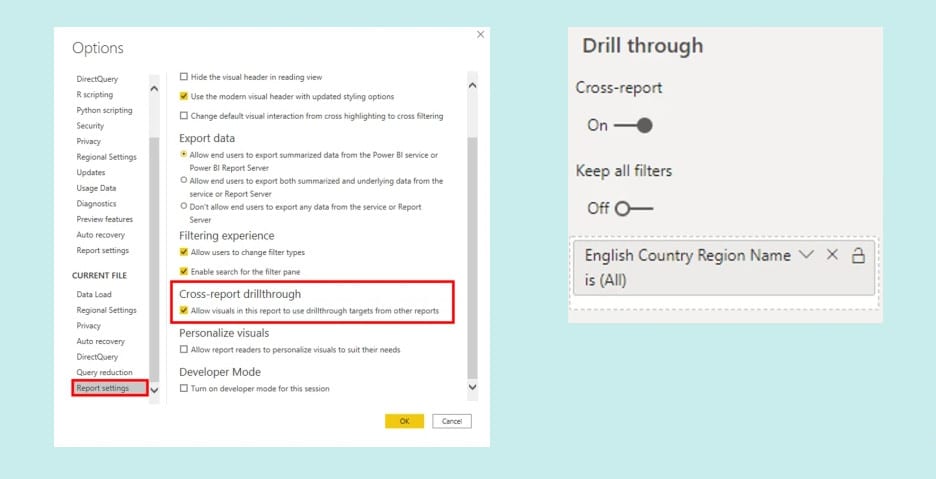
To enable the retention of applied filters, go to the Drillthrough section of the visualization panel and activate the “Keep all filters” option by setting the switch to “On”.
When drilling down to a visual, you can consult the list of applied filters. They are shown in italics in the Drillthrough section of the control panel.
Another Power BI feature is “Drillthrough Cross-Report”. This allows you to connect several reports with related content, so you can easily switch from one to the other.
How do I learn to use Power BI?
Now you know how to use the Power BI Drillthrough feature. However, this is just one of the many subtleties of Power BI!
If you want to learn how to use this software to the full, DataScientest is the place to be. Our Power BI training course enables beginners to fully master the platform in just five days.
The entire course lasts 38 hours. However, beginners can be satisfied with the three-day introductory course, and advanced users can go straight into the two-day in-depth program.
Through this course, you will learn to handle the various facets of Power BI, such as the Power Query engine, the DAX language, data modeling and DataViz. You’ll be able to analyze data, visualize it and create dashboards.
As a Microsoft Learning Partner, DataScientest is authorized to prepare and administer the PL-300 exam. This test leads to official Microsoft Power BI Data Analyst Associate certification!
Our government-recognized organization is eligible for funding options and our program is entirely distance learning via the Internet. To learn how to use Power BI, discover DataScientest now!
Now you know all about Drillthrough Power BI. For more information on the same subject, take a look at our complete dossier on the DAX language.


