Power BI is Microsoft’s cloud-based Business Intelligence tool for managing and analyzing your data. Thanks to its DataVisualization features, you can visualize at a glance all your key indicators across all your activities, and easily interpret them.
With its technology, ETLs and computing power, Microsoft’s Power BI gives you incredible speed to connect hundreds of pieces of data, analyze them and prepare reports in real time.
Power BI is a set of software services, applications and connectors that work together to transform disparate data sources into immersive, interactive visual information. Data can be in the form of Excel spreadsheets or hybrid local or cloud-based data warehouses. Power BI makes it easy to connect to data sources, visualize and discover what’s important, and share that information.
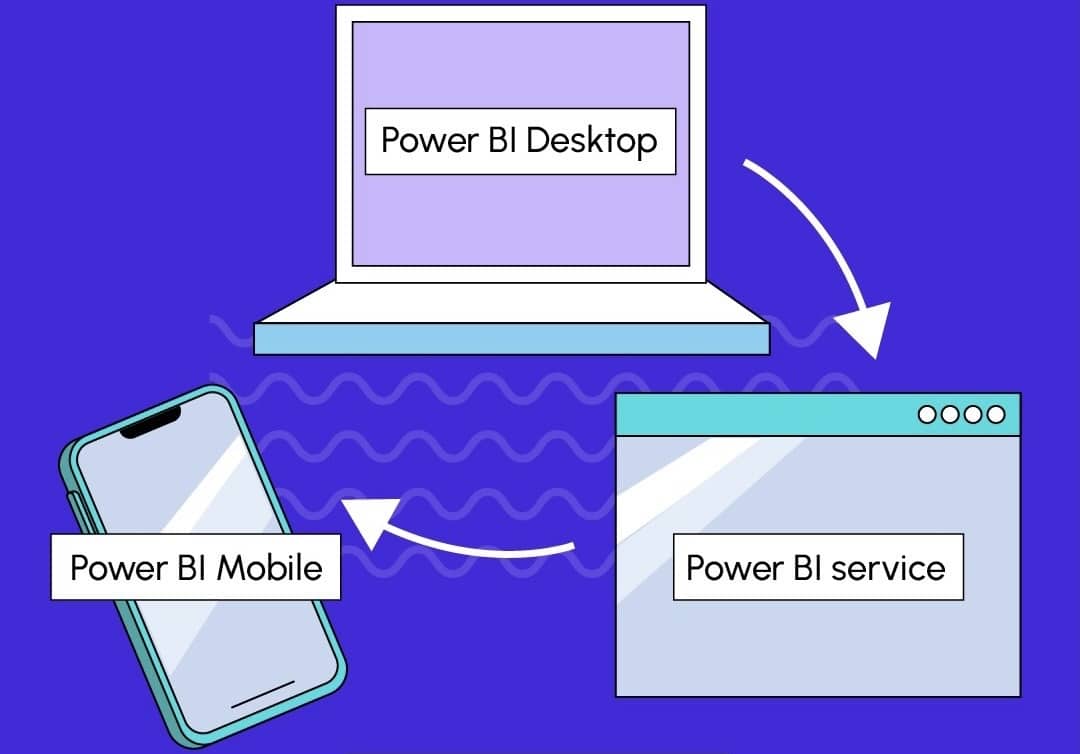
Power BI is made up of several components that work together, including these three basic elements:
- A Windows desktop application called Power BI Desktop.
- An online SaaS (Software as a Service) service called Power BI Service.
- Power BI mobile applications for Windows, iOS and Android devices.

These three elements are designed to enable business insights to be created, shared and consumed optimally, according to business needs or roles.
Why use Power BI in the retail sector?
Personalize your customers' experience
With so many customers buying online, they expect more than loyalty points and discounts. Quickly and efficiently gain visibility into the insights, buying habits and forecasts you need to truly connect with them.
- Identify, adapt and respond to your customers’ ever-changing needs, across all channels.
- Use hundreds of data connectors to combine petabytes of data from different internal and external sources.
- Deliver rich, consistent customer insights.
Employee autonomy
Your employees are your brand’s most valuable ambassadors. Give them the Power BI tools and distribution technologies they need to deliver the best possible customer experiences.
Create a more collaborative environment by letting your employees generate actionable insights in real time using familiar tools and applications.
Keep employees connected, wherever they are, whether in the back office or in-store.
Boost productivity in a safe and secure environment: use Power BI and Microsoft Azure Information Protection to manage data access, security and compliance.
💡 Related articles:
An intelligent supply chain
Get the right product, at the right price, to the right customer, at the right time, by bridging the gap between demand generation and execution.
- Reduce costs and improve operational efficiency by boosting end-to-end flexibility.
- Use data-driven insights to anticipate and respond to evolving customer demand both globally and locally.
- Improve the transparency and speed of in-market logistics with data-driven insights, while improving capacity utilization and inventory allocation between your stores and warehouses.
Reinventing the distribution sector
Accelerate your company’s innovation, flexibility and overall distribution resilience to achieve growth, regardless of market changes and disruptions.
- Adopt a forward-looking business strategy using Power BI’s Machine Learning, AI and visualization capabilities.
- Limit the impact of unforeseen challenges by shifting your business from emotional reaction to proactive anticipation.
- Create a digital foundation and data culture in your organization to meet ever-changing customer demands.
In addition to increasing competition, uncertainty is another challenge facing the retail sector. Digital access to information from the various players in the retail sector has heightened consumer expectations, and now their demands are no longer the same.
Today, consumers place equal importance on products and services. They expect a seamless experience and faster satisfaction.
The retail sector needs to focus on data collection and analysis to keep pace with increasing demand and changing consumer expectations.
Power BI transforms raw data into actionable information, giving you a 360-degree view of the entire enterprise, from factory to shop floor.
Power BI enables retail companies to understand their customers’ buying and selling habits through the story that the data collected can tell, and through its analysis. It is packed with powerful features enabling retailers to visualize data according to their needs and priorities.
What’s more, they can share important information such as customer engagement, loyalty patterns, customer experience and basket abandonment with specific services.
The retail sector can take advantage of a suite of reporting, forecasting, prediction and analysis tools in any form they wish.
In addition, Power BI dashboards can be customized to segment data according to different axes of analysis, or predictive modeling can be created for accurate sales forecasts.
Predictive analysis with Power BI
The future may be unknown, but we have the ability to predict it when it comes to business. The importance of profit prediction in business cannot be overstated. While there are many approaches and analytical tools for predicting profitability, Power BI is one of the best tools to use for this type of analysis.
There are unlimited possibilities for profit prediction when using Power BI. The key is to learn how to implement the right development techniques.
You can calculate what the future of your results might look like using a combination of DAX calculations and modeling techniques in Power BI.
Below, a forecasting analysis based on previous years’ sales, calculating the evolution of earnings according to different sales and purchasing scenarios:
With the right Power BI training, you’ll be more adept at manipulating and analyzing lots of data to find a high-performance BI solution tailored to your needs.If you don’t have an IT support team to build web-based dashboards, Power BI training will help you get there without too much difficulty.
You’ll learn how to use Power BI Desktop software to import, sort and analyze data (structured, actual and budgeted) from a variety of sources. Once you’ve done that, you’ll be able to create the right report for profit margin analysis, the differences between real data and budget…
Would you like to learn how to master this tool?
Discover the beginners and advanced courses designed by DataScientest to train you in just a few days on this tool increasingly used in business.


