The Power BI Info Bubble, also known as Tooltip, lets you add contextual information and detailed data to a report’s DataViz. Simply hover the mouse cursor over the visual to display them. Find out all you need to know: presentation, operation, benefits, tutorial, training…
A Power BI report is very useful for presenting data in the form of visualizations, aesthetically pleasing and easy to understand. However, when data is plentiful, DataViz can quickly become confusing.
Fortunately, there’s a Power BI feature that helps solve this problem. The tooltip allows you to display detailed data in the form of contextual bubbles.
💡 Related articles:
What is a Power BI tooltip?
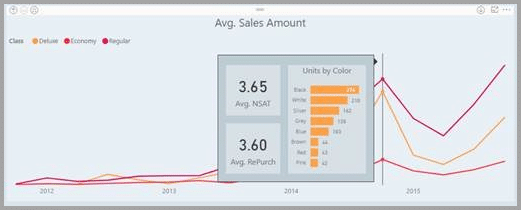
Power BI’s tooltips present contextual data and detailed information on a data visualization. Simply move the mouse cursor over the various points in the report to display the tooltips.
For example, values and categories can be displayed. In addition, a tooltip can be customized to provide more precise information. This gives users more information and context, providing access to additional data points.
Tooltips are particularly useful for presenting deep trends within a dataset. However, it’s not always necessary to add them to a DataViz.
How does Power BI work?
Power BI tooltips display information on the screen when the user hovers the mouse cursor over a visual element of the report. They can be added to any visual.
These interactive annotations can be used to lighten and clarify reports.
For example, the tooltip saves space when creating a report. The user can focus on an element and display related information as required.
One use case is business logic. Power BI Tooltips can be used to provide explanations of calculations, making measurements easier to understand.
In addition to Tooltips, Power BI offers a number of features to simplify reporting. These include the “Drill Up” and “Drill Down” functions, which let you explore data in greater detail or, on the contrary, access an overview.
Power BI Tooltip: advantages and disadvantages
Power BI tooltips offer several advantages. It offers contextual information, or even instructions to help the user.
Generally speaking, these Tooltips help users to understand the most complex elements so they can fully exploit Power BI reports and DataViz.
However, a Tooltip is not always adequate. It is important to use this tool only when it is useful, to avoid cluttering up a report unnecessarily.
How do I create a tooltip for a Power BI report?
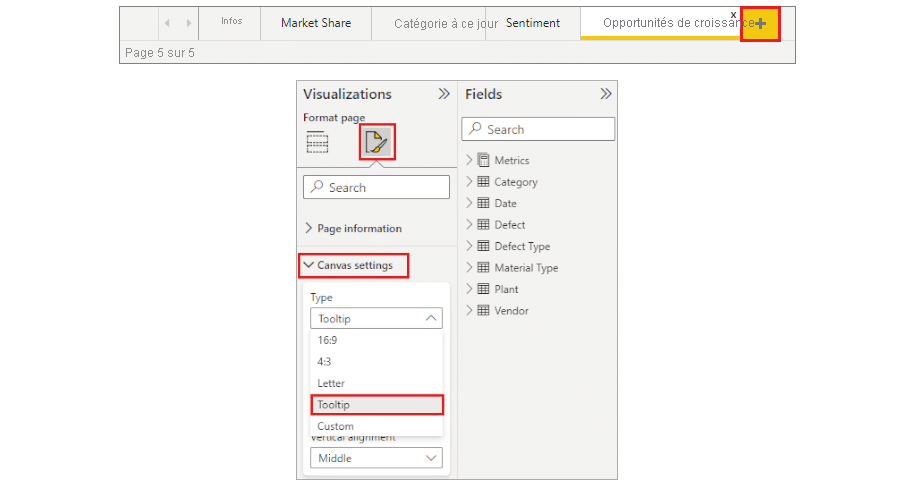
To create a Power BI tooltip on a Power BI report, the procedure is very simple. Start by creating a new page, then open the Format panel and expand the “Page Size” tab. For “Type”, choose Bubble Info.
Then go to the “Page Information” section and check that the Bubble Info option is activated. Also make sure that the view is set to “Actual Size”, so that the entire canvas space can be used.
Then start building your Bubble Info, combining all the visuals of your choice. The process is identical to creating a Power BI report.
Now you can apply your Bubble Info to the chart of your choice. Select it, then choose the Bubble Info in the “Page” tab and activate it.
How do I learn to use Power BI?
Power BI Tooltips make data visualizations simpler and clearer. They can be customized to create more interactive Power BI reports.
To learn how to handle Power BI and all its subtle features, you can choose DataScientest. Our Power BI training program enables beginners to master Power BI in just 38 hours over five days!
You’ll learn all about the Power Query engine, the Dax language and DataViz. As a Microsoft Learning Partner, DataScientest is authorized to administer the PL-300 exam for official Microsoft Power BI Data Analyst Associate certification!
This training is entirely distance learning via the Internet, and our government-recognized organization is eligible for funding options. Don’t wait any longer and discover DataScientest!
You’ll know everything there is to know about Power BI bubbles. For more information on the same subject, take a look at our complete dossier on Power BI or our dossier on the DAX language.
Power BI Tooltips make data visualizations simpler and clearer. They can be customized to create more interactive Power BI reports.
To learn how to handle Power BI and all its subtle features, you can choose DataScientest. Our Power BI training program enables beginners to master Power BI in just 38 hours over five days!
You’ll learn all about the Power Query engine, the Dax language and DataViz. As a Microsoft Learning Partner, DataScientest is authorized to administer the PL-300 exam for official Microsoft Power BI Data Analyst Associate certification!
This training is entirely distance learning via the Internet, and our government-recognized organization is eligible for funding options. Don’t wait any longer and discover DataScientest!
You’ll know everything there is to know about Power BI tooltips. For more information on the same subject, take a look at our complete dossier on Power BI or our dossier on the DAX language.


