MeanShift is a clustering algorithm widely used in computer vision and data analysis. Find out everything you need to know about its history, how it works and its areas of application!
In the early 1990s, image processing and computer vision researchers Dorin Comaniciu and Peter Meer were looking to overcome the challenges associated with image segmentation and object tracking.
At the time, traditional methods based on thresholds or statistical models were limited in their ability to handle objects with complex shapes and textures or variations in lighting and background.
To overcome this problem, the two researchers invented a powerful method that is still widely used today in computer vision and data analysis: the mean shift algorithm.
What is MeanShift?
In their work, Comaniciu and Meer realised that the mean shift could be used to search for regions of interest in an image.
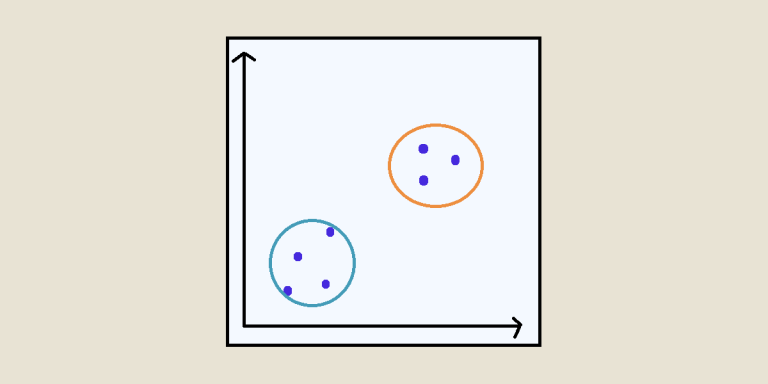
This technique involves iteratively moving data points towards regions of maximum density, using a search window and a kernel.
The aim is to determine both the extent of the search and the way in which the points are moved. The density of points is evaluated in a region around a point defined by the search window.
The kernel specifies the shape of the density distribution used to evaluate the proximity of points. It is these two elements that enable the Mean Shift algorithm to find local modes in a data distribution.
An essential computer vision technique
The two researchers therefore decided to use this principle for computer vision, in order to group together similar points in an image to detect distinct regions.
This approach proved to be very effective, as it enabled areas of interest to be identified automatically without the need for thresholds or prior models.
Mean shift is still used today for image segmentation based on colour or texture levels. It is also used to detect objects by grouping similar regions in a scene.
This algorithm is also used in image processing to enhance images by reducing noise and improving edge sharpness. It can also be used to track moving objects in a sequence of images.

MeanShift and data analysis
In addition to computer vision, this technique is also widely used for data analysis. For example, it can be used to segment maps and satellite images, or to detect clusters of human activity in geospatial data.
The marketing sector also uses Mean Shift to segment customers according to their buying behaviour and preferences. This makes it possible to target campaigns more effectively and personalise offers.
In the field of social networks, Mean Shift can be used to identify communities or groups of individuals with similar interactions. This can help to understand the social structures and dynamics within these platforms.
Several sectors such as cybersecurity, finance or video surveillance also apply this algorithm to detect abnormal behaviour such as fraud or intrusion.
For biomedical data analysis, Mean Shift can be used to segment medical images with a view to detecting pathologies or analysing electroencephalographic signals.
It is even possible to use this technique to group text documents according to their semantics, in particular to organise large collections or recommend similar content.
How do I use MeanShift?
The Mean Shift algorithm is based on several key steps. Firstly, the data must be formatted and pre-processed to select the appropriate features and avoid any bias in the results.
Initial centroids are then selected from the data itself or randomly. These serve as starting points for iterations of the algorithm.
Next comes the iteration stage, during which the points are moved according to the density of the surrounding points. The centroids are updated each time and the points are moved in the direction of the regions of maximum density.
This iteration continues until the points converge towards the local modes and the centroids no longer move significantly.
Different convergence criteria can be used, such as the distance between successive centroids or the decrease in total variation.
One of the key parameters of this algorithm is the size of the search window. It influences the maximum distance over which points are moved, and can have a significant impact on the clustering results.
Choosing the optimum window size is therefore essential. It is possible to use cross-validation techniques to assess the quality of clustering for different sizes and identify the one that maximises cluster coherence.
The type of kernel must also be selected according to the characteristics of the data and the desired results. The most commonly used are Gaussian and uniform. This choice affects the way in which the density is estimated, and therefore the shape and size of the clusters obtained.
This adjustment of the parameters is essential. You can experiment by evaluating clustering performance using metrics such as the silhouette index or intra-cluster inertia.
What are the other clustering algorithms?
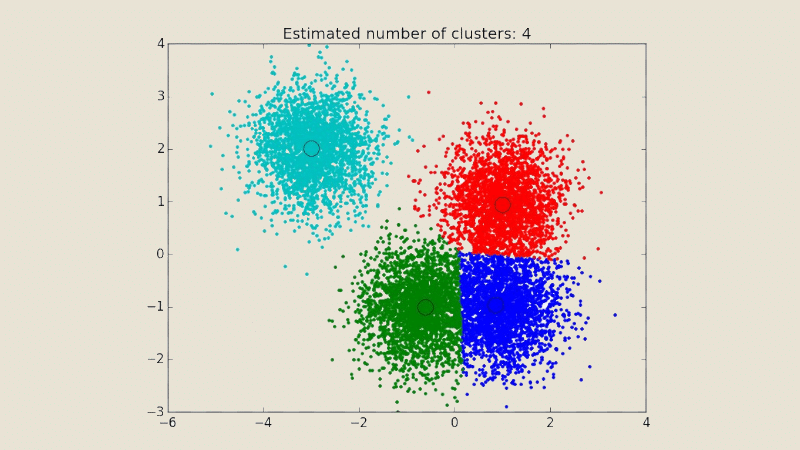
There are several other clustering algorithms. Compared with K-Means, MeanShift is better suited to data with non-convex cluster shapes and variable sizes.
This is because it is not necessary to specify the number of clusters in advance, as they can be identified automatically by finding local modes in the data. This makes MeanShift more flexible and adaptive to real data.
Also, compared with DBSCAN, this algorithm does not require parameters such as neighbourhood radius or minimum number of points to form a cluster.
It is able to find clusters based solely on point density and using the adaptive search window. However, DBSCAN may be more appropriate for variable density datasets and for detecting outliers.
Another important difference with Mean Shift is its non-parametric nature. It can be adapted to different types of data without any prior assumptions.
It therefore does not need to assume specific cluster shapes or uniform densities. Once again, this makes it easier to adapt to complex structures and non-linear data.
Conclusion: MeanShift, a key algorithm in computer vision and data analysis
Clustering is an essential technique in data analysis, for grouping together similar observations.
The Mean Shift algorithm is a popular method because of its non-parametric approach and its ability to identify local modes.
It is a powerful and flexible approach that can be applied in a wide variety of fields.
To learn how to master all the techniques and tools of data analysis, you can choose DataScientest.
Our various training courses enable you to acquire all the skills required to work as a Data Analyst, Data Scientist, Data Engineer, ML Engineer or Data Product Manager.
You’ll learn about the Python programming language, DataViz software, database analysis and manipulation tools, Business Intelligence and Machine Learning.
Our courses can be completed entirely by distance learning and are eligible for funding options. You can also obtain certification from MINES ParisTech PSL Education or our partners AWS and Microsoft Azure. Discover DataScientest!


