The world of BI (Business Intelligence), and more specifically data analysis, comprises a large number of tools and services. It’s not always easy to find your way around, compare and choose. This comparison will give you a clearer picture. We have chosen the 3 most popular tools on the market:
Let’s start the comparison with the matrix produced by Gartner on the ability to execute and vision in the market. It’s no coincidence that we find these 3 tools as leaders.
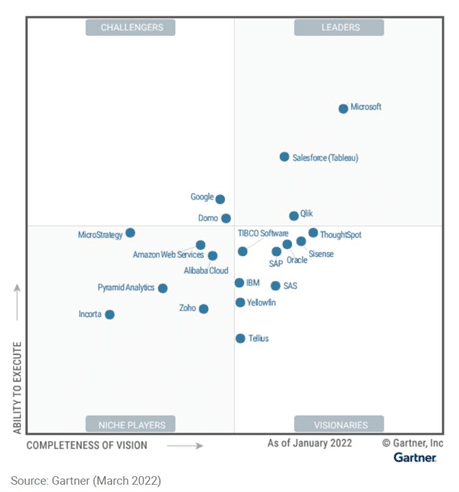
Microsoft, Tableau and Qlik are the leaders. We also find Google with Looker and Data Studio, MicroStrategy and many others, but they don’t keep up with the pace set by the 3 editors.
Before we start comparing tools on the basis of different criteria, here’s a quick overview of the most popular data visualization tools.
Power BI

It’s one of the newest tools in the BI world. Power BI, created by Microsoft, has become a leader thanks to its integration into the giant’s panoply of software and services. Suitable for both home users and professionals, Power BI will help you analyze your data.
Tableau

Almost 20 years after its creation, Tableau is still an important tool in the BI panorama. And its acquisition by Salesforce in 2019 is no coincidence.
Qlik

One of the pioneers of the field, and as relevant as ever, Qlik has been able to adapt and offer ever more powerful tools. We’re talking about a host of products such as Qlik Sense and Qlik View.
Tool comparison
The 3 tools provide solutions that are broadly identical in terms of basic functionality. Where they differ is in their interface, ease of use and certain advanced features.

Interface
When it comes to getting to grips with the tools and understanding the interface, Microsoft knows what it’s doing, and has reproduced Excel’s winning formula to offer a similar interface. It’s not the most modern or innovative, but it keeps things simple and intuitive.
Tableau and Qlik approach this point differently, with a more graphic, more modern interface that emphasizes storytelling. The aim is not to limit ourselves to a few graphs, but to render information with the intention of telling a story, to be even more relevant.
Advantage to Tableau, the most advanced tool.
Data preparation
It is essential to use the right tools for this crucial and mandatory step in data analysis. While it’s customary to use tools such as Talend, Informatica or even Python for this step, all 3 editors offer tools of varying levels of performance for this task. Qlik Replicate, Tableau Prep and Power Query allow you to make the essential modifications required to prepare the data before making it available.
The advantage goes to Power Query, which is directly integrated into Power BI, unlike the other 2, which must be considered in addition to the visualization tool.
Versioning
When developing a new dashboard, versioning is a must. It allows you to retrieve an old version in just a few clicks, with the potential for easy deployment. Tableau is the only company to have implemented this functionality with Revision history. For Qlik and Power BI, you’ll have to go through a third party to obtain this historization.
Self-Service BI

Offering users the possibility of analyzing their own data multiplies the number of possible analyses by making the necessary data sets available. Tableau is certainly less well equipped in this respect, unlike Qlik Sense or Power BI, which were designed with this in mind.
Costs
Public prices are more or less clear from one vendor to another, and above all depend greatly on the needs and uses we may have. From the point of view of a professional organization, Tableau is certainly the most expensive to deploy (Creator – $70 per user per month), followed by Qlik (Business – $30 per user per month) and Power BI (Pro – $10 per user per month).
For individual users, each publisher offers free versions, QlikView, Power BI Desktop and Tableau Public.
Power BI is favored for its competitive pricing.
Cloud
Qlik, and more specifically Qlik Sense, is the most flexible, as it is compatible with the best-known cloud providers: AWS (Amazon), GCP (Google) and Azure (Microsoft). It is also possible to have a hybrid architecture with several cloud providers.
On the Tableau side, cloud deployment features are included in the price, enabling better cost management. Like Power BI, Power BI Service or a pro account (see above) provides access to a wide range of functions. Logically, however, you’ll have to make do with Microsoft’s Azure.
The advantage here lies with Qlik, which is more mature.

Integration
As far as the local environment is concerned, Power BI Desktop is the most restrictive, as it requires a Windows computer. This can be limiting in some cases, whereas Qlik and Tableau offer Linux and Mac as well.
When it comes to integrating external sources, Power BI is the winner. With a fluidity of exchanges through Microsoft services (Power Apps, Azure, Office 365, Teams, …) , the tool has a considerable advantage.
Community
What can make the difference in the adoption and understanding of a tool is its community. Qlik and Tableau try to engage their users, but Microsoft, through its experience, manages to build strong, willing communities. One of the most telling examples of this is undoubtedly the community of developers who participate and contribute to the addition of connectors and functionalities, and to the answers provided in the forum. Listening to and nurturing a community is very important, and in this respect, Power BI is undoubtedly the winner.
💡Related articles:
Conclusion
All tools have their strengths and weaknesses, but certain criteria can be decisive in the choice of one solution or another. These may be financial, integration or cloud issues. This comparison highlights some of the advantages and disadvantages, so it’s up to you to decide which tool to choose. And if the choice is too difficult to make, you can also decide to choose 2 of them to have complementary functionalities.


