
Power BI’s SUMX function calculates the sum of the products of all the rows in a table. Find out everything you need to know about this iterative function, and how to take a Power BI training course!
Microsoft’s Business Intelligence and Data Visualization tool, Power BI, is a resounding success in the enterprise. This software is transforming the way data analysis is used to solve business problems.
Power BI makes it easy to work with data. Its real-time analysis, modeling and customization features open up a wealth of possibilities.
What’s more, the DAX (Data Analysis Expressions) language brings together functions, operators and constants used to create formulas and expressions in Power BI.
These mathematical functions reveal the full value of your data. One of the most important Power BI functions is SUMX, used to obtain the sum of expressions in a table.
What is Power BI?
Power BI is a Business Intelligence and Data Visualization platform developed by Microsoft. It enables organizations to analyze data and generate reports based on the results.
The platform brings together a wide range of tools, applications and connectors for extracting actionable information from data, creating immersive visuals and interactive reports.
In fact, Power BI is a self-service Business Intelligence tool. This means that data can be aggregated, analyzed and visualized very easily to produce compelling reports.
Data from multiple sources such as Oracle, SAP or the data warehouse of your choice can be collected using Power BI. This platform can handle anything from a single Excel file to a vast volume of Big Data.
What are the strengths of Power BI?
Power BI has proven itself as a reliable and intuitive tool for data analysis and visualization. Its immense popularity is linked to several strong points.
Firstly, its multiple connectors enable data to be extracted from a wide variety of sources. In addition, teams can share access to reports in a secure and controlled way.
Another strength of Power BI is the ability to display real-time data and visuals in any report or dashboard. Dashboards are updated in real time, enabling problems to be solved and new opportunities discovered instantly.
The platform also offers a wealth of customization possibilities, allowing users to tap into its catalog to create visualizations to suit their needs. Custom visualizations can also be generated using DataViz modules in the R and Python languages.
Thanks to the artificial intelligence features added in recent updates, users can use techniques such as image recognition or text analysis to prepare data, develop Machine Learning models, and rapidly extract actionable information.
What is SUMX?
Power BI’s DAX (Data Analysis Expressions) language brings together over 200 functions, operators and constants, offering great flexibility for data analysis tasks.
The iterative SUMX function calculates all the rows in a table and returns the sum of the products. In this way, it first calculates the product of each field’s values before adding them together.
All iterative functions apply the calculations to each row one by one. Other Power BI iterative functions include COUNTX, RANKX and PRODUCTX.

SUMX syntax
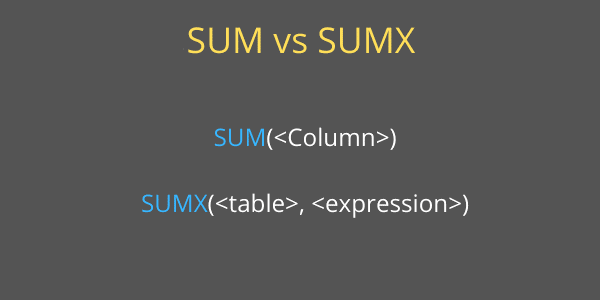
In terms of syntax, a typical SUMX function takes this form: SUMX (<Table>, <Expression>).
The “Table” parameter indicates the name of the table to which the DAX SUMX function is applied. Steps or iterations will be performed on the rows of this table.
The “Expression” parameter is the expression or equation to be evaluated on each line. The result of the sum is returned as a SCALAR value.
How do I use SUMX in Power BI?
Applying the SUMX function to Power BI is very simple. After loading the dataset and naming the table, simply right-click on the table and choose “New Measure”.
Name the measure as you like, open the SUMX function and specify the name of the table and the expression to be evaluated. Close the brackets and parentheses and press the “Enter” key to obtain the result.
To view the results, click on the “Report” tab and select from the list of views. Drag the appropriate fields into the “Values” tab to obtain the sum table.
What's the difference between SUMX and SUM?
It’s essential to understand the difference between the SUM and SUMX functions in Power BI. Learning how to use these functions correctly enables you to dive deeper into raw data and extract actionable information with ease.
Using these functions takes the complexity out of analysis, and reveals the full potential of the data. Although they may seem similar, these two functions are quite different.
Power BI has two basic calculation engines: the aggregation engine and the iteration engine. The DAX SUM function is linked to the aggregation engine and adds up all the values in a single column to return the result.
It considers a single column as a whole and returns a result. Aggregation functions cannot perform evaluations on every row of a table.
SUMX, on the other hand, is an iterative function with a different approach. It can perform calculations row by row, and iterates over each row of a specified array to complete the calculation. The results of each row are then added together.
How to choose between SUMX and SUM?
The function SUMX can be used whenever a row-by-row calculation is required. If the data is structured in such a way that it is necessary to multiply the values of two columns one row at a time, this function must be used.
In addition, SUMX can also operate on a single column. It is therefore theoretically possible to use SUMX as a simple aggregator, thanks to its iterative nature. However, this function consumes more resources than SUM, and can have a negative impact on dashboard performance.
Function SUM, on the other hand, can be used for all single-column calculations and when line-by-line execution is not required. If data is structured to contain a single column of values, function SUM can be used to sum the values. This function operates on a single column, and therefore does not require an iterator.
How to master Power BI
Data professionals around the world use Microsoft Power BI to examine data from multiple sources and create compelling charts, dashboards and reports.
The tool’s features make it easy to import, transform and visualize data to create high-quality reports. However, mastery of both DAX and SUMX functions is required to take full advantage of the data.
If you want to learn how to fully master Power BI and its more subtle functions, you can choose DataScientest. Our Power BI training course enables you to master the platform in just 38 hours over five days.
As a Microsoft Learning Partner, DataScientest can prepare you to take the official PL-300 certification to become a Microsoft Power BI Data Analyst Associate.
Alternatively, beginners can take the Power BI Dashboarding course. This 24-hour course, spread over three days, teaches how to use tools such as DAX and Power Query to analyze data and create dashboards with Power BI.
Conversely, those who are already familiar with Power BI can opt for the Advanced course. This 14-hour course, spread over two days, uncovers all the secrets of the tool, including DataFlows and Incremental Refresh.
As far as financing is concerned, DataScientest is eligible for different funding options. Don’t wait any longer, and discover Power BI training!
You’ll know everything there is to know about the Power BI SUMX function. For more information on the same subject, take a look at our complete dossier on Power BI and our dossier on its DAX language.


