
Introduction
You’ve probably already heard of Machine Learning being used to predict the price of a house or in the field of sports betting. It has a wide range of uses, and you’re probably wondering how it can be used to carry out such a wide variety of projects.
In previous articles, we talked about setting up a suitable environment and exploring the necessary data before starting to model a ML project. If you haven’t already read them, we advise you to do so before moving on to modelling.
On today’s agenda: how to organise the stages involved in modelling the project problem.
Model selection
If you have followed the steps in the previous article, your dataset and production environment should be ready for modelling.
Let’s start by modelling the problem, i.e. transforming the problem into a particular task.
Types of learning
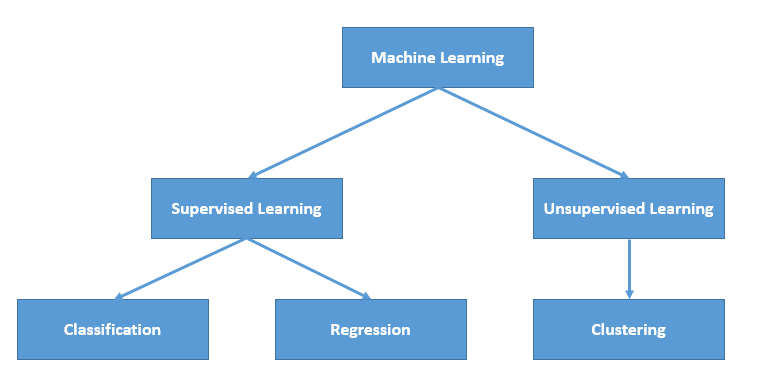
We distinguish two main families in the ML field: supervised and unsupervised learning.
Note: There are also other types of learning, such as semi-supervised learning and reinforcement learning, which we will not explore in this article.
The question to ask yourself to determine which family your problem belongs to is the following: Do you have the target variable for my project?
Your target variable is the column you are trying to predict. If you have the values for this column, you are in supervised learning.
If, on the other hand, you are trying to obtain an estimate of this column without having the exact values, you are in unsupervised learning.
1) Unsupervised learning.
In the case of unsupervised learning, you will need to use the following techniques:
- Clustering (Kmeans, MeanShift, Spectral Clustering, etc.)
- Dimension reduction algorithms (PCA, TSNE)
- Anomaly detection (EllipticEnvelope, IsolationForest)
Need to brush up on these topics? They’re all covered on our blog.
Let’s move on to supervised learning.
2) Supervised learning.
If, on the other hand, your dataset contains the target variable, you need to ask yourself whether the column you are trying to predict is a continuous or categorical variable.
A continuous variable is, for example, the price of a house or the time a person spends on a site before making a purchase.
A categorical variable, on the other hand, has a finite and restricted number of modalities, such as an age group or the different types of loyalty subscription offered by a particular telephone company.
There are many different regression algorithms. These include linear regression, random forests and SVM regression.
There are also many classification algorithms, such as decision trees or the SVM model.
Once again, don’t panic, if you feel that a refresher on these algo’s would be useful, we have dedicated an article to them on the blog that we invite you to have a look at.
Display supervised or unsupervised learning?
In both cases, there is no magic formula. You need to test the different models to determine which will give you the best performance.
However, if you are using a classification model and your classes are unbalanced, it is advisable to rebalance your dataset using resampling techniques.
Deep models and neural networks can also be used for both regression and classification. Often, they will give you higher performance, but they have two disadvantages that need to be taken into account.
Neural networks are very prone to overlearning (i.e. they are difficult to generalise) and are not very interpretable. What we mean by interpretable is that it is complex to understand and anticipate their decisions.
Model selection and optimisation
You now have the performance of each of the models that could be applied to your problem. Now you need to select the best performing model, but how?
Cross-validation is a very useful technique that lets you know whether your model is generalizable: in other words, whether it behaves well when it encounters new data.
It also allows you to find the optimal hyper-parameters of your model in parallel with the optimisation method. There are several methods for optimising hyper-parameters, such as the `GridSearchCV` function, random search or Bayesian optimisation…
Metric
Obtaining the performance of tuning models, but according to which metric?
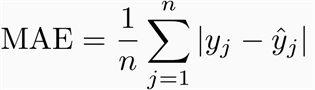
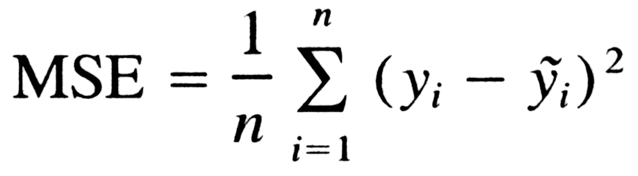
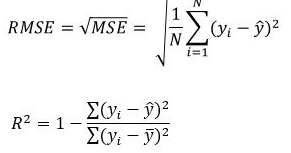
For regression problems, you can consider the MAE, MSE or R2 metrics.
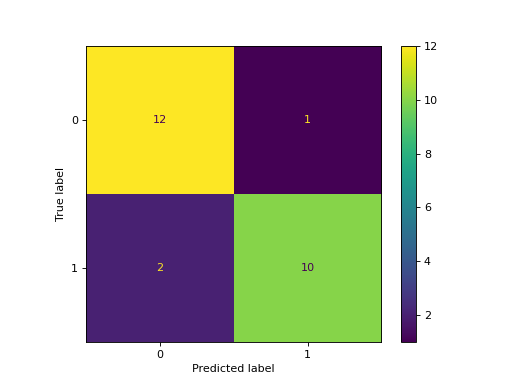
For classification problems, you can use the confusion matrix or classification report tools.
The confusion matrix is a practical representation of the precision of a model with two or more classes, while the classification report will give you more information about other measures (such as recall, f1 score, etc.).
Finalisation
At this stage, you have the performance of your different models on your dataset with the optimal hyper-parameters, as well as the evaluation metric(s). You can now compare their performance and agree on the best model.
To do this, you need to consider not only the model’s performance, but also its interpretability. In certain fields, such as medicine or autonomous driving, it can be crucial to understand how your model makes its decisions. So you need to take these two concepts into account to find the best compromise and agree on the most appropriate model.
Conclusion
Now you know how to carry out the various modelling stages of your project.
If you liked this article or the others, don’t forget to subscribe to our YouTube channel to be alerted to Data Science topics that might interest you.


