
After depicting the digital transformation of the finance function, that of chartered accountancy and auditing firms, in this article we will attempt to present a concrete example of a real-life situation. The main objective here is to understand how acculturation to a tool like Microsoft Power BI redefines the operational realities of a group of companies.
The term “Business Intelligence” first appeared in 1958[1]. It can be defined as “a technological process for analysing data and presenting information to help (…) business end-users make informed decisions[2]”.
Background to the GS group
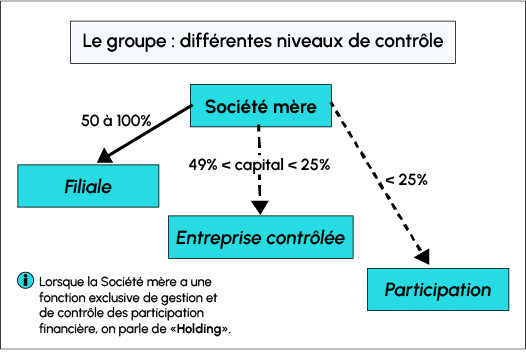
The “GS” group of companies is made up of 3 legal entities:
- Parent company “SM” ;
- Subsidiaries A and B, 100% owned.
In order to improve the supervision of the Group’s day-to-day activities, a 100% digital and collaborative reporting process is envisaged. It should be noted that within the group’s finance function, the financial director works closely with the head of accounts, who is responsible for the Fichier des Écritures Comptables (FEC) for each of the group’s legal entities.
With this in mind, and as an extension of its office suite, the GS Group aims to exploit its data using the leading Business Intelligence tool: Microsoft Power BI.
Data sources
The sources of data to be exploited and targeted by the stakeholders correspond mainly to the accounting records files (FEC) produced by the various entities in the Group.
Introduced by article 14 of the amended finance law no. 2020-1510 of 29 December 2012, the FEC has had to be presented in the event of an audit by the tax authorities since 2014. The information derived from it corresponds to standards codified in Article A.47 A-1 of the Book of Tax Procedures[3]. In terms of structure, the FEC must comprise a series of eighteen mandatory fields. The said article (VII, 2°) provides for a variant concerning information 12 (“Debit”) and 13 (“Credit”) which may also be presented in the form of “Amount” and “Direction”. Entities in the same group may then present an FEC with a different format, as is the case within the GS group.
The combination of standardised FECs at group level would enable the GS group to respond to its main operational problems.
External growth and standardisation of practices
Following on from the previous need, Power BI must also facilitate the gradual standardisation of practices, particularly in the event of external growth.
During the various life cycles of a group of companies, the acquisition of a new legal entity is not uncommon.
In the context of external growth, the operational habits of a new subsidiary are confronted with the practices of the group. Discrepancies can have a direct impact on the quality of the information provided. From a financial point of view, for example, the application of a common reference system makes it possible to standardise accounting and presentation methods.
In order to identify the rigour with which each entity in the group keeps its individual accounts, the final tool must enable ongoing investigation of the data generated.
In addition, in the context of mandatory or voluntary consolidation[4], the use of a Business Intelligence tool must make it possible to satisfy the group’s more general needs: the democratisation of consolidated data within the teams, the optimisation of the decision-making process and the generalisation of fluid and dynamic financial communication. By using the integrative dimension of Power BI, the subsidiaries participate alongside the centrally-positioned finance function in standardising practices across the group.
Ultimately, the monitoring of the financial balance of activities becomes more reliable.
💡Related articles:
The financial balance of economic activity
Through global supervision of activities, group management must constantly ensure the continuity of operations.
Power BI makes it possible to centralise and visualise accounting and financial information at group level. Its implementation represents an asset for the finance function in particular, in its day-to-day management of activities.
A BI tool is the best way of establishing a lasting dialogue with operational staff, while promoting a balance between profitability and financial equilibrium.
Particular attention needs to be paid to the group’s cash position and debt. The final tool must therefore enable daily monitoring of the level of available cash, while providing specific monitoring of the ratios relating to the Group’s banking covenants. In addition to standardising practices, Group management must also ensure the financial sustainability of the business as a whole.
Similar to a cash pooling policy[5], the finance function needs to be able to visualise the group’s overall financial position and monitor the various banking covenants that need to be met.
As with the previous issues, accounting data is an essential source for creating visuals and key indicators for the GS group.
Assessment and implementation of key management indicators
In addition to the income statement, the finance function will also need to monitor the group’s assets and liabilities.
In order to construct the balance sheets of the various entities, the Group’s reference framework can once again be used. Transactions from the various FECs should be broken down according to their nature. A summary view of the balance sheet could then be presented as follows:
In addition, certain management indicators linked to the balance sheet should be proposed, in particular: Working Capital Requirement (WCR), the Group’s net debt ratio. This would provide the finance function with additional indicators enabling it to monitor the asset management of the various entities:
Finally, as mentioned above, the finance function is responsible for ensuring the Group’s financial equilibrium.
Monitoring cash flow and financing
Following on from the previous visuals, it is also essential for the group finance function to monitor the overall level of cash.
In the case of the GS Group, cash flow monitoring can be represented as follows:
In addition to the visual display above, the Group’s finance function may need general indicators to give a direct view of common concepts:
the overall level of cash and cash equivalents: in addition to cash and cash equivalents, this indicator also includes marketable securities in particular;
net debt: bank debt less cash and cash equivalents.
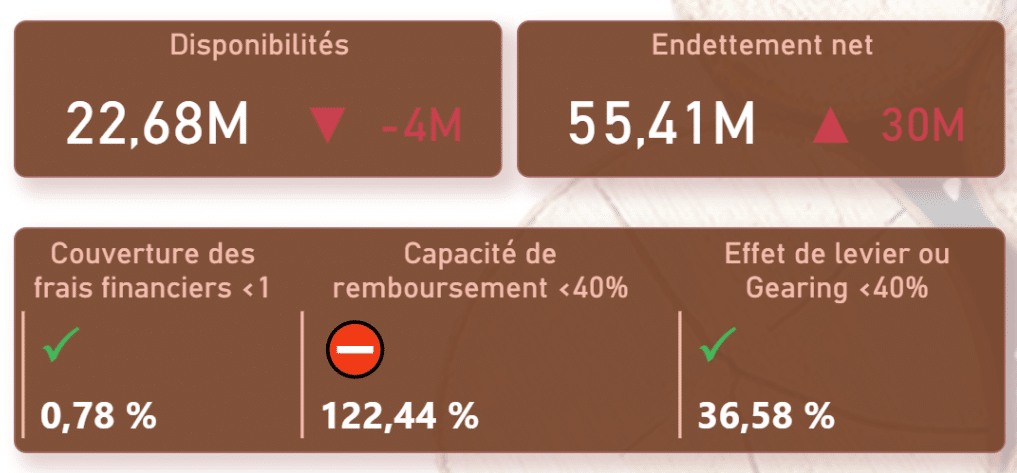
Secondly, given the financing characteristics of the GS Group, a second set of indicators could also be useful. In the context of bank loans, contractual clauses known as ‘covenants’ may be applied. These clauses may take the form of ratios, failure to comply with which during the financing phase may result in early repayment of the underlying loan. It is therefore essential that they are monitored throughout the financial year:
Using the visuals and indicators it has built up, the GS Group now has a Power BI report that can be used to address the issues outlined above.
Conclusion
In this article, we presented the context of the GS group in the context of its global performance management.
The main issues specific to groups of companies were addressed here. Power BI is an invaluable tool for the management of a group, its shareholders and its finance function, providing them with a continuous consolidated view of accounting and financial information.
The group’s financial statements and key management indicators enable the finance function to supervise the performance of the business as a whole. What’s more, its scope of investigation is strengthened by the ability to navigate continuously between the macro and micro levels of day-to-day operations. Finally, cash flow and indicators linked to loan contracts are also monitored.
The next article will look at the case of an industrial SME, whose commercial performance requires separate management and the use of specific data beyond its accounts.
Notes
- LUHN H. P., (1958), A Business Intelligence System, IBM Journal, Vol. 2, pp. 314-319.
- https://www.oracle.com/fr/database/business-intelligence-definition.html
- https://www.legifrance.gouv.fr/codes/article_lc/LEGIARTI000027804775 (accessed August 2022)
- PAPINEAU D., (2022), Comptes consolidés volontaires : les apports de l’automatisation et de la visualisation, Revue française de comptabilité, no. 560, p. 28-31.
- Cash pooling or centralisation of cash in French


