
After depicting the digital transformation of the finance function and that of public accounting firms, in this article we will attempt to identify the benefits of a Business Intelligence tool for the auditing profession. The main objective here is to understand how acculturation to a tool like Microsoft Power BI redefines auditors' practices within a computerized environment. With this in mind, a 4-step approach will be proposed.
As a reminder, the term “Business Intelligence” first appeared in 1958[1]. It can be defined as “the technological process of analyzing data and presenting information to help business end-users make informed decisions”[2].
The auditor and Big Data
The ongoing digital revolution is affecting our entire economy. The auditing sector has not been spared by the digital transformation of its businesses.
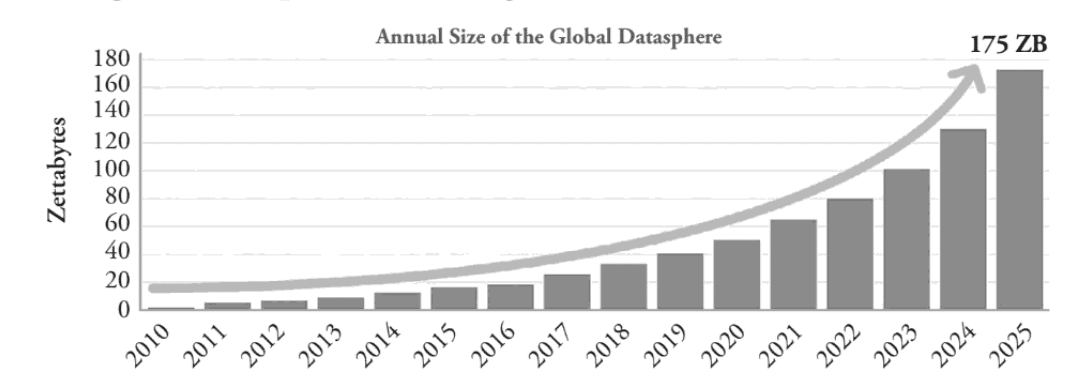
While the term “Big Data” was first used in 1997 by two NASA researchers[3], it has since come to refer to the exponential volume of data available and produced around the world, as illustrated in the figure below:
The term “Big Data” thus corresponds to a very large volume of structured and unstructured data. The latter exist in many forms, and have characteristics initially derived from the “3Vs[4]”, subsequently extended[5] :
- the Volume of data to be processed, which is constantly increasing as a result of the growing digitization of the economy;
- The speed required to produce an appropriate response in a timely fashion;
- Variety of information, which may be structured or unstructured (with no predefined format);
the Veracity of the data, to minimize biases linked to a possible lack of reliability; - or the Added Value obtained by exploiting the data to achieve the objectives set beforehand.
Data alone represents the digital transformation of organizations. The auditor must adapt his working methods to take into account the data generated by the information system.
The information system (IS) as a data provider
According to Robert Reix, an IS is defined as “an organized set of resources (…) enabling information to be acquired, processed, stored and communicated[6]”. It comprises both a technical structure (the technologies used) and an organizational structure (the people who use these technologies).
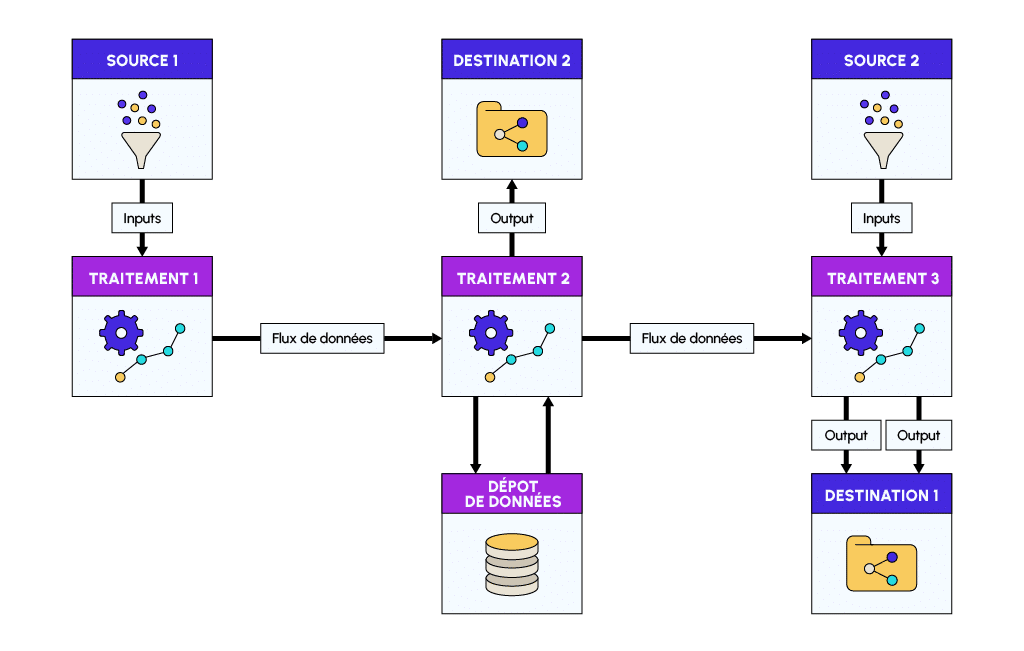
The information system represents a key challenge for the modern auditor, as it centralizes raw data (inputs) from various sources, before making them available in the form of results (output):
The rapid and continuous development of computerization in recent years has made companies of all sizes and in all sectors increasingly dependent on their information systems. By relying on the latter, BI tools enable auditors to exploit several types of data generated by the organization: accounting, financial, commercial, etc. It’s all a question of understanding how the auditor can convert these data into business intelligence.
The key, however, is to understand how the auditor can convert the available data into information in order to carry out his or her analyses.
The decision-making information chain, or converting data into information
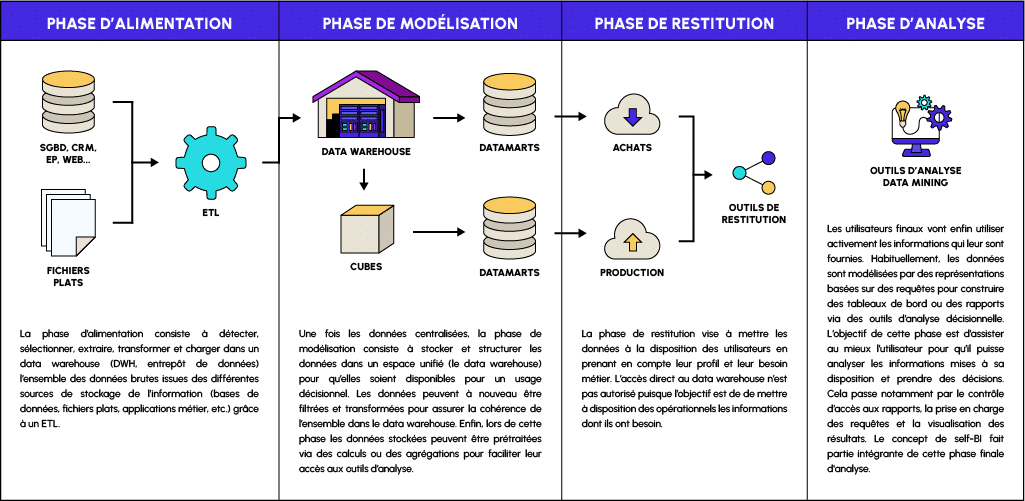
The 4 stages of the decision-making information chain for the auditor can be defined as follows:
| Steps | Definitions |
|---|---|
| Feeding | The first phase of the decision-making process involves collecting raw data. This phase is made possible through an "ETL" (Extract, Transform, Load) to deal with the disparity of existing formats. |
| Modeling | The modeling phase structures the centralized raw data within the Datawarehouse, making it available for reporting. |
| Reporting | During reporting, reprocessed data is distributed to different recipients in the form of reports, statistics, dashboards, etc. This phase is also called DataViz (Data visualization). |
| Analysis | Finally, the analysis phase involves leveraging the provided information to draw conclusions. |
The process of the auditor’s exploitation of the organization’s raw data can ultimately be illustrated by the following figure:
It should be noted that all the steps described above can be managed using a Business Intelligence tool. Among the tools on the market, the Compagnie Régionale des Commissaires aux Comptes (CRCC) de Paris identified Microsoft Power BI in 2021, as “a powerful vector for the acculturation of professionals to data analysis and data-driven auditing[7]”.
Using data from an organization’s information system, Power BI represents a revolution for the auditing sector.
The benefits of Power BI for internal auditors
At the same time, Power BI is part of the digital transformation of internal auditing. Like the statutory auditor, the internal auditor is particularly interested in the effectiveness of internal control, taking into account the overall impact of the information system on the organization.
These two concepts refer to reference frameworks established across the Channel and well known to internal auditors: COSO, defined in 1992 by the Committee Of Sponsoring Organizations of the Treadway Commission, and COBIT, formulated in 1996 by the Information System Audit & Control Association (ISACA).
According to IFACI[8], the mission of internal auditing is to increase and preserve the value of the organization by providing advice based on a risk-based approach. By taking advantage of the benefits of Business Intelligence, the departments in charge of internal control see their scope of investigation strengthened, with the possibility of navigating in real time between the macro and micro levels of daily operations.
As a result, an internal audit unit is able to provide independent, informed feedback on the extent to which the organization is in control of its operations. To make decision-making more reliable, Power BI helps to supervise activities across an organization or group of companies. Using the data produced by each business unit or subsidiary, and despite any geographical distance, such a tool enables continuous analysis to be carried out centrally. Based on key indicators and/or automated analysis methods, internal auditors adapt their working methods by developing a mixed approach between business skills and a strong data culture.
By using a tool like Power BI, internal auditors can develop their data analysis skills and modernize their approach by taking advantage of the disruptive technologies available.
How does an audit work with Power BI?
Given the multitude of possible anomalies, auditors need to adapt their controls. To do this, he needs a modern, customizable tool. Microsoft Power BI fully meets this need. To integrate such a tool into the audit process, the following steps can be followed:
1) Choice of data sources
Thanks to its integrated ETL (Extract, Transform, Load) function, Power BI can handle a wide variety of data sources from the information system, including Excel, pdf or text files, SQL, Oracle or Access databases, CRM, etc. The challenge for the auditor at this stage is to identify the data sources he or she wishes to exploit.
The challenge for the auditor at this stage is to identify the data sources he wishes to exploit. To do this, discussions will need to be held with both the business and IT departments (DSI, MOE, MOA, etc.).
The auditor can then convert the imported data into information based on key indicators.
2) Choice of key performance indicators
Power BI enables auditors to set up their own reporting processes, using customized dashboards. By adapting to the realities of the field (business sector, internal practices, data quality, etc.), the auditor is able to use Power BI to parameterize the indicators, ratios and visual graphics that will enable him to make his analyses more reliable.
Based on the risks identified, automated monitoring of the defined indicators is carried out over time. At all times, the auditor retains control of his KPIs in the face of changing organizational risks. With the implementation of the Microsoft Power BI software suite, the auditor’s proactivity is put back at the heart of the control strategy.
3) Automated analysis
To personalize the audit process as much as possible, professionals can also set alerts and samples based on their investigation thresholds. Thus, within Power BI, filters and sorting can be applied automatically to the populations tested throughout the year. These specific focus points can then be used to supervise certain sensitive themes such as fraud and cash management (e.g. automatic filters on high-risk denominations or transaction patterns). Pre-configured control points can also be used to guide audit teams in their work, particularly at group level where the various subsidiaries may be geographically distant from the central teams.
In addition to setting specific thresholds and filters, a tool such as Power BI enables auditors to customize their analysis reports.
4) Other customizations
The tool’s wide range of visuals provides the auditor with a broad spectrum of possible graphics. Depending on the subjects and risks addressed, you can choose the appropriate visual (e.g. scatterplot, decision tree, geographic visualization, etc.). The customization of selected graphs is continued within Power BI by means of conditional formatting options.
Starting from a blank sheet of paper, the auditor can organize his approach by choosing his own visual identity, adding graphics, titles and text zones, adjusting font size, etc. In addition to the visualizations offered natively by the editor, a complete catalog of additional graphics is also available.
All in all, with Power BI, the auditor has complete control over his or her audit approach, from selecting data to customizing analysis reports.
💡Related articles:
Conclusion
In this article, we set out the current context for auditors in their mission of control and analysis.
Given the exponential growth of data generated by organizations and the preponderance of information systems, Microsoft Power BI offers real opportunities for the modern auditor. They can enrich their approach and become a true “digital trusted third party” for their internal and external customers.
However, getting your teams acculturated to Power BI requires a learning curve that should not be overlooked. It’s a real cultural change, and new working habits need to be put in place. The ultimate goal is to improve practices by increasing the amount of time devoted to analysis.
With this in mind, don’t hesitate to make an appointment with one of our consultants.
Notes
- LUHN H. P., (1958), A Business Intelligence System, IBM Journal, Vol. 2, p. 314-319.
- https://www.oracle.com/fr/database/business-intelligence-definition.html
- Cox, M., Ellsworth, D., Gestion des grandes données pour la visualisation scientifique, ACM Siggraph, Mai 1997, 97, 1-17
- LANEY D., Gestion des données 3D : Contrôler le volume, la vitesse et la variété des données, Gartner, 949, 6 Février 2001.
- PATGIRI R, AHMED A., Big Data : Les V du paradigme qui change la donne, International Conference on High-Performance Computing and Communications, Décembre 2016.
- REIX R. (1983), Le système d’information : une réalité vivante, Revue française de gestion, (43), p. 6-13.
- https://www.crcc-paris.fr/appel-doffres-modele-power-bi-danalyse-du-fec (consulté en juillet 2022)
- L’Institut Français des Auditeurs et Contrôleurs Internes


