
After depicting the digital transformation of the finance function, that of chartered accountancy firms and auditing firms, in this article we will attempt to present a concrete example of a real-life situation. The main objective here is to understand how acculturation to a tool such as Microsoft Power BI redefines the supervision of the commercial performance of an SME or ETI- mid-sized company.
The term “Business Intelligence” first appeared in 1958[1]. It can be defined as “a technological process for analysing data and presenting information to help (…) business end-users make informed decisions[2]”.
Let's take an example: The company NATIX
The SME NATIX operates in the industrial sector.
In order to improve the analytical monitoring of the entity’s sales, a 100% digital and collaborative reporting process is envisaged. It should be noted that within the group’s finance function, the financial director works closely with the sales manager, who is responsible for the SME’s commercial performance.
With this in mind, and as an extension of its office suite, the entity aims to exploit its data via the leading Business Intelligence tool: Microsoft Power BI.
Data sources : Which ones to use?
The data sources to be used by the stakeholders correspond mainly to files from the sales management application used internally. To date, these files correspond to the following elements: N and N-1 files provided by the sales administration and exported from the sales management application.
In addition, and specifically for the second need expressed below, the finance function will use the Fichier des Ecritures Comptables (FEC) produced by the entity. This must be produced in compliance with the standards codified in article A.47 A-1 of the tax procedures book.
To date, the parties envisage updating the various data sources on a monthly basis in order to set up a periodic update of the reporting.
The combination of these different data sources should enable the entity’s main commercial issues to be resolved.
💡Related articles:
Analytical monitoring of sales
The management of an SME or ETI may find it difficult to monitor the quality of the sales generated by the entity’s various operational activities. Especially if this aggregate is mainly supervised remotely.
Sales represent the commercial performance of an organisation, and the various analytical dimensions available make it possible to improve monitoring.
First of all, a first level of analysis could be dedicated to customers or related groups (network, brand, etc.) in order to produce rankings in the form of charts or “top customers”. Subsequently, a finer mesh would be dedicated to the typology of products sold.
Similarly, if the organisation has several business lines or activities, a more synthetic view is also useful in order to monitor the proportion of each segment over time. Finally, periodic and geographical dimensions are also essential to enable the finance function to investigate the performance achieved both over time and in space.
In addition to this analytical monitoring, a reconciliation between accounting and management can also be established to ensure that the data is exhaustive and reliable.
Differences between accounting and invoicing
To guarantee the financial sustainability of any organisation with commercial activities, the collection of invoices issued is essential.
Commercial management represents the main source of data taken into account for the construction of the target reporting for the NATIX SME. From a treasury point of view, the invoicing process enables the organisation to launch collection campaigns. It is therefore desirable for the organisation to monitor any disparities between general accounting and sales management.
To do this, the complementary use of the entity’s FEC will enable the accounting data to be compared with the management data. Automatic reconciliation of these sources will make it possible to check the completeness of the information between the two environments and thus detect any invoicing discrepancies.
Ultimately, the SME’s reporting can be enriched by additional areas of analysis from the commercial environment. For example, monitoring prices charged and volumes sold could help the finance function in its task of supervising sales performance.
Price and volume effects
In addition to the dimensions mentioned above, other analytical axes can be encountered.
As is the case for NATIX, periodic variations in an industrial activity can be analysed in terms of certain components. From a management control perspective, for example, changes in sales performance can be broken down into price and volume effects. Sales in this type of sector are most often made up of unit prices and quantities sold. Differences can therefore be observed, particularly between two successive periods:
The price effect, linked to the impact of changes in selling prices on sales and calculated between two periods N and N-1 as follows:

- The volume effect, linked to the impact of changes in quantities sold on sales and calculated between two periods N and N-1 as follows:

Please note that the sum of these two effects must correspond to the variation in sales between the two periods being compared. The commercial performance of the NATIX SME can therefore be steered with full knowledge of the facts. In an increasingly competitive environment, such visibility on the components of sales means that corrective action can be taken if necessary.
In the light of the above developments, sales data would appear to be ideal for feeding into a digital and collaborative reporting system.
Visualisation and monitoring with Power BI
First of all, the finance function needs to break down the monitoring of NATIX’s sales using the different analytical axes available.
To do this, it needs to take advantage of the various dimensions derived from sales management. They can then be used by the finance function to analyse the data for reporting purposes. Visuals can be created to provide the finance function with key information that can be read directly.
The figure below shows a breakdown of the SME’s sales between its various operational business lines:
The ‘Matrix’ format, also available in Power BI, enables the data to be viewed in several dimensions. In the figure below, different categories of third parties form a hierarchy that can be used to refine the reading of the data as the analysis progresses. For example, by looking at the ‘Brittany’ group of operations, a finer breakdown is then available at the ‘Customer groups’ level:
It is also essential to set up a systematic reconciliation between the two main sources used by the finance function in the course of its activities: accounting and invoicing.
Reconciliation between accounting and billing
In order to improve the vision of the finance function, the invoicing process can be made more reliable by reconciling the accounts with commercial management.
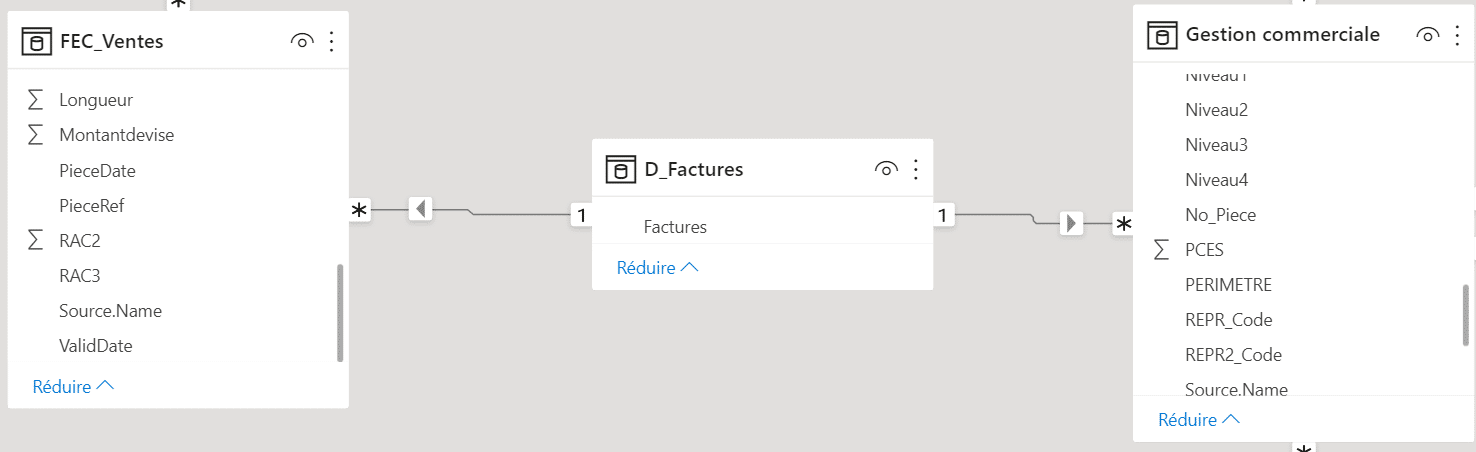
In the case of NATIX, this involves the use of the FEC. With this in mind, a reconciliation can be carried out with sales management using a common field corresponding to invoice numbers. To do this, a table of dimensions made up of all the invoices must make it possible to link the two previous sources:
Finally, a reconciliation between accounting and invoicing from sales management can be envisaged by making a distinction between :
invoices issued in management but not yet accounted for,
and conversely, invoices present in the accounting system but absent from the sales management process.
By systematically reconciling these two main environments, the finance function can secure the recognition of sales.
By extension, monitoring average prices can also be invaluable.
💡Related articles:
Monitoring cash flow and financing
Following on from the previous visuals, and depending on the quality of the data sources obtained, additional indicators can be proposed.
Among these, the notion of “average selling price” (ASP) enables the finance function to monitor the organisation’s commercial performance on a regular basis. This performance is then broken down into the various analytical areas, in particular by activity, customer or, more precisely, by item.
In addition, in order to refine the analysis of sales variations, price and volume effects can also be materialised:
In addition, among the standard visuals available in Power BI, the one that allows data to be represented in space can also help the finance function in its steering role. If sales management contains a field specific to the delivery town or department, this can be linked to a corresponding analytical table:
Following on from the previous developments, the finance function now has a modern reporting system that meets the needs of sales administration.
Conclusion
In this article, we presented the context of the NATIX SME in the context of monitoring its commercial performance.
The main issues specific to SMEs and SMIs were addressed here. Power BI is an invaluable tool for company management and the finance function, providing ongoing qualitative monitoring of sales performance.
In fact, the visuals created to monitor NATIX’s sales analytically enable the company to supervise its sales performance. What’s more, the calculation of average sales is set up in such a way as to be accessible to all analytical levels of sales management.
Finally, the finance function benefits from increased visibility of the geographical distribution of sales and the potential efforts to be made in terms of commercial development.
Notes
- LUHN H. P., (1958), A Business Intelligence System, IBM Journal, Vol. 2, p. 314-319.
- https://www.oracle.com/fr/database/business-intelligence-definition.html


